Work/
Cisco

Intense data made accessible

A vision for how Cisco’s ThousandEyes shows its densest data.

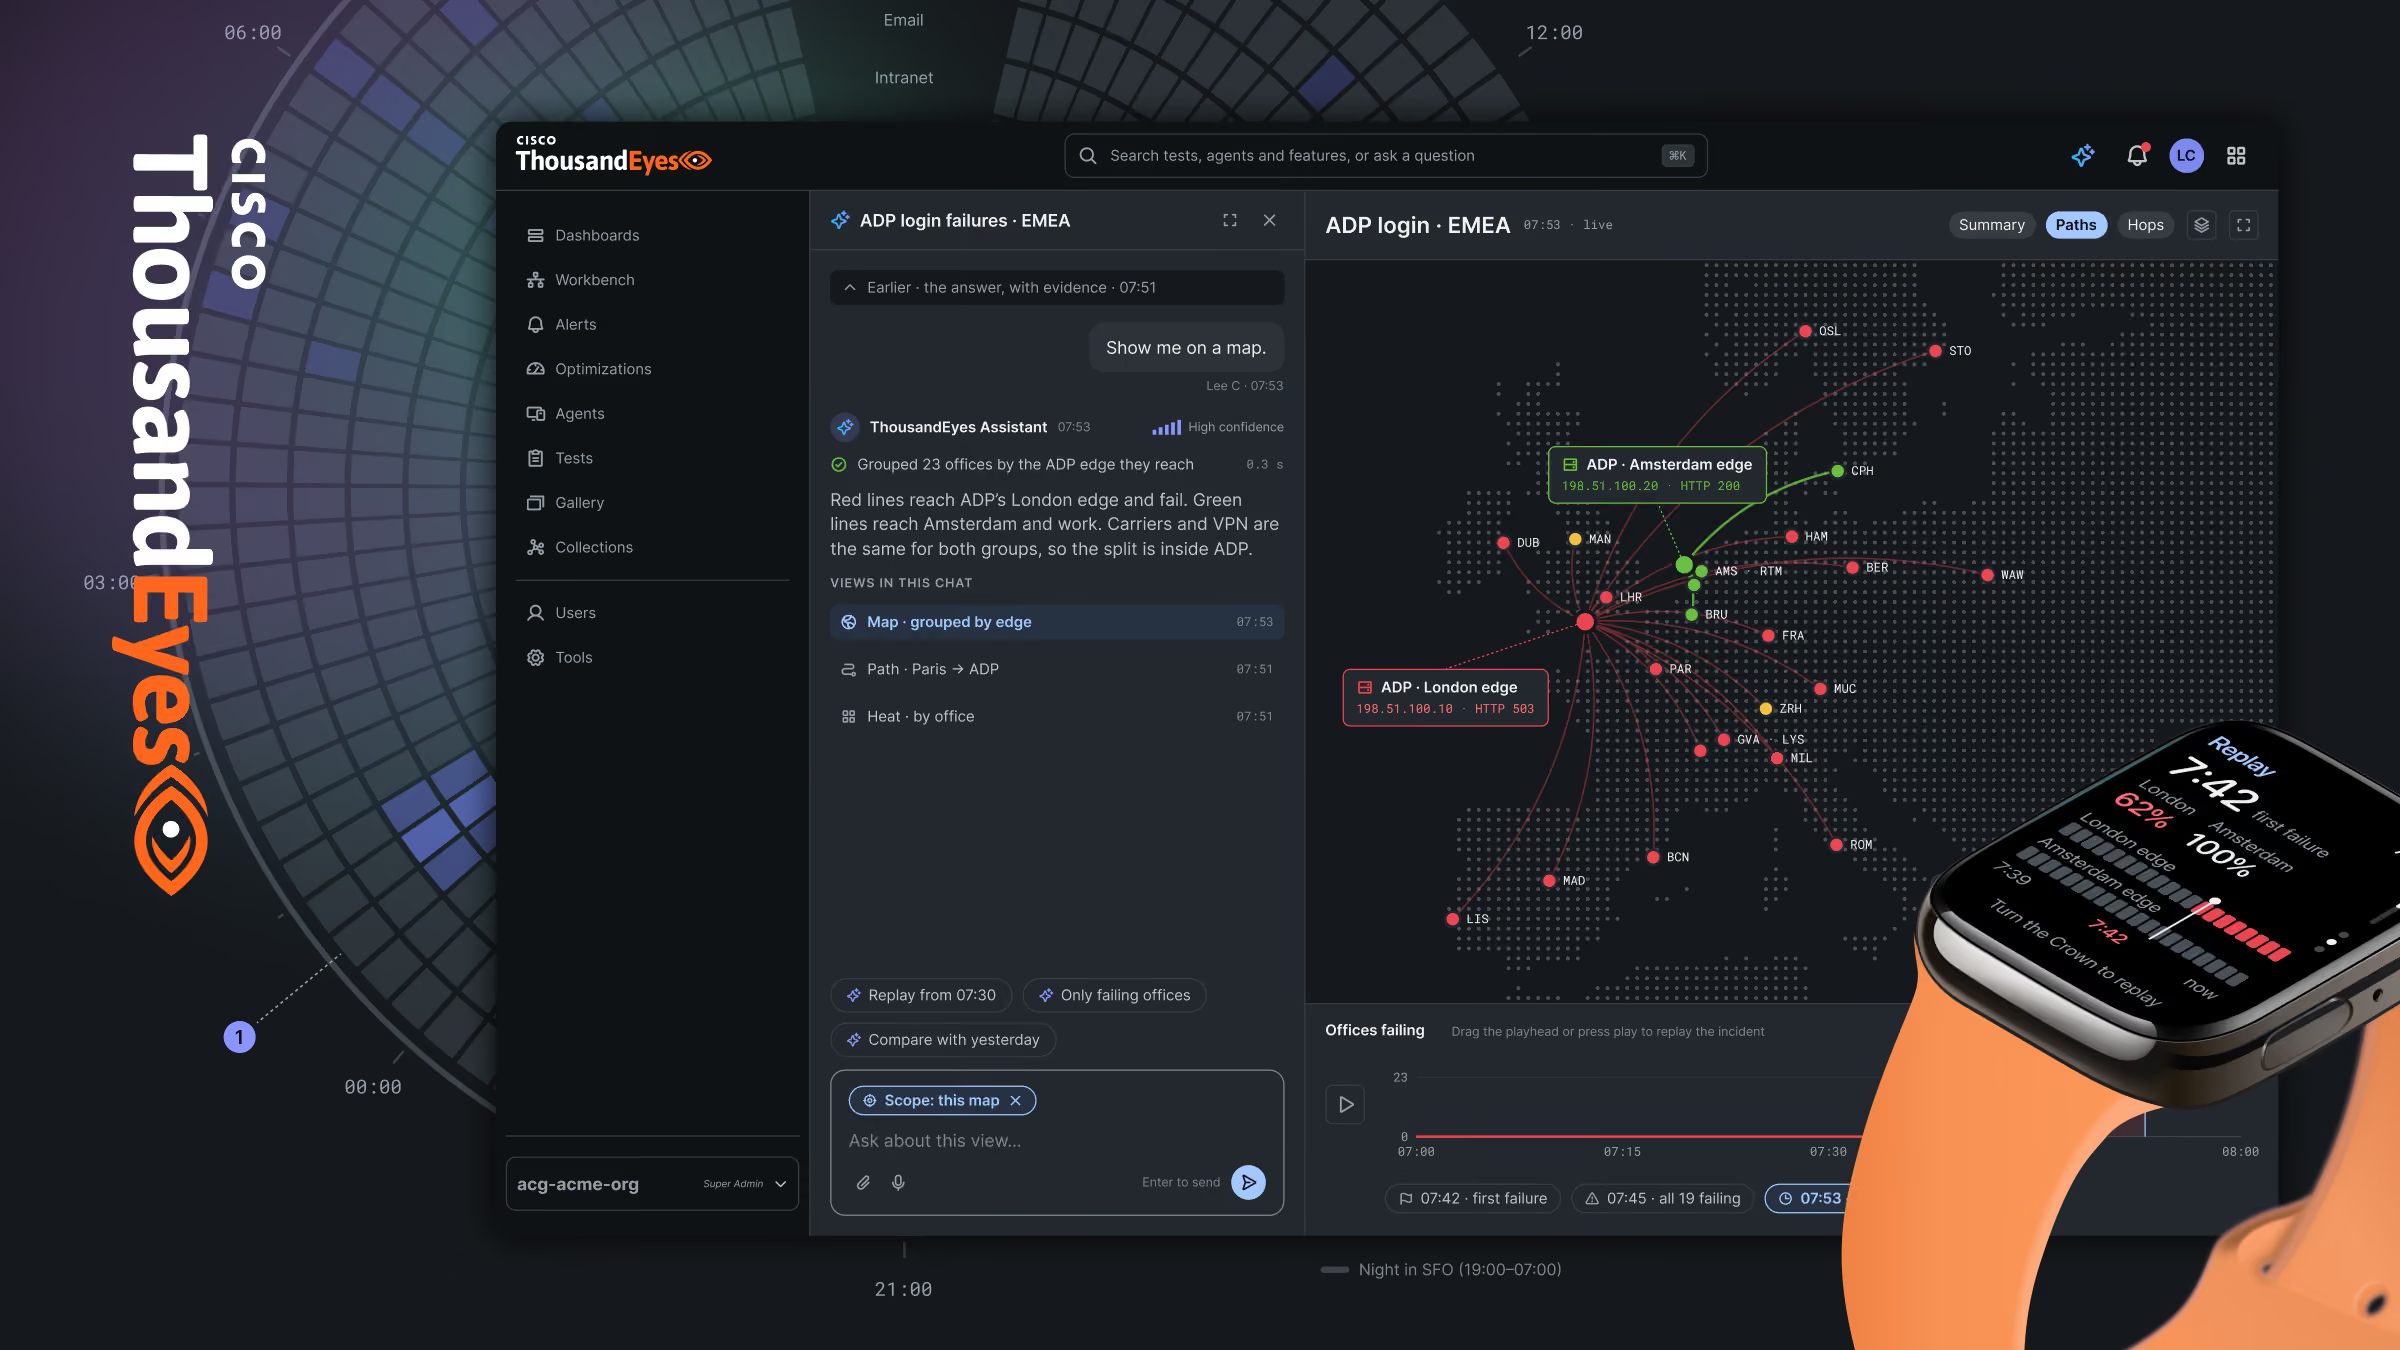
ThousandEyes dashboard with network data and an AI chat panel, beside a smartwatch showing an alert
Client
Cisco
Role
Supplemental design partner
Timeframe
Oct. 2024 - Dec. 2024
Stage
Concept
Platforms
Mobile app, web and wearable
Focus
Future product strategy and design

Cisco’s ThousandEyes sees everything that happens on a network. The people who run that network just want to know what’s wrong. We designed a ThousandEyes that would tell them first and show the proof second.

The challenge

ThousandEyes measures every path from every office to every app, every few minutes, and the answer stayed buried in it. Operators had to decode dense screens before they could act.

The idea

Lead with a plain verdict, prove it with the evidence beside it, and let the same data take whichever form the question needs, on the desk, the phone and the wrist. Healthy stays gray, so the failure is the only thing in color.

The outcome

We audited what already worked in ThousandEyes to set the design rules, then applied them across the desk, the phone and the wrist.
The outcome
The approach

The audit set the rules.

Discover

We looked at what already worked in ThousandEyes, and at how operators read its data today.

Design

We thought about the answer first, with the proof beside it, on the desk, the phone and the wrist.
Test

We brought our favorite direction to Cisco, along with what operators would need to confirm before any build.

Deliver

Cisco has a vision to build toward, where every view starts from a plain answer.

UI kit

One kit for design and code

A design system is what lets a product grow without losing itself. We built the UI kit so design and code would stay one-to-one.

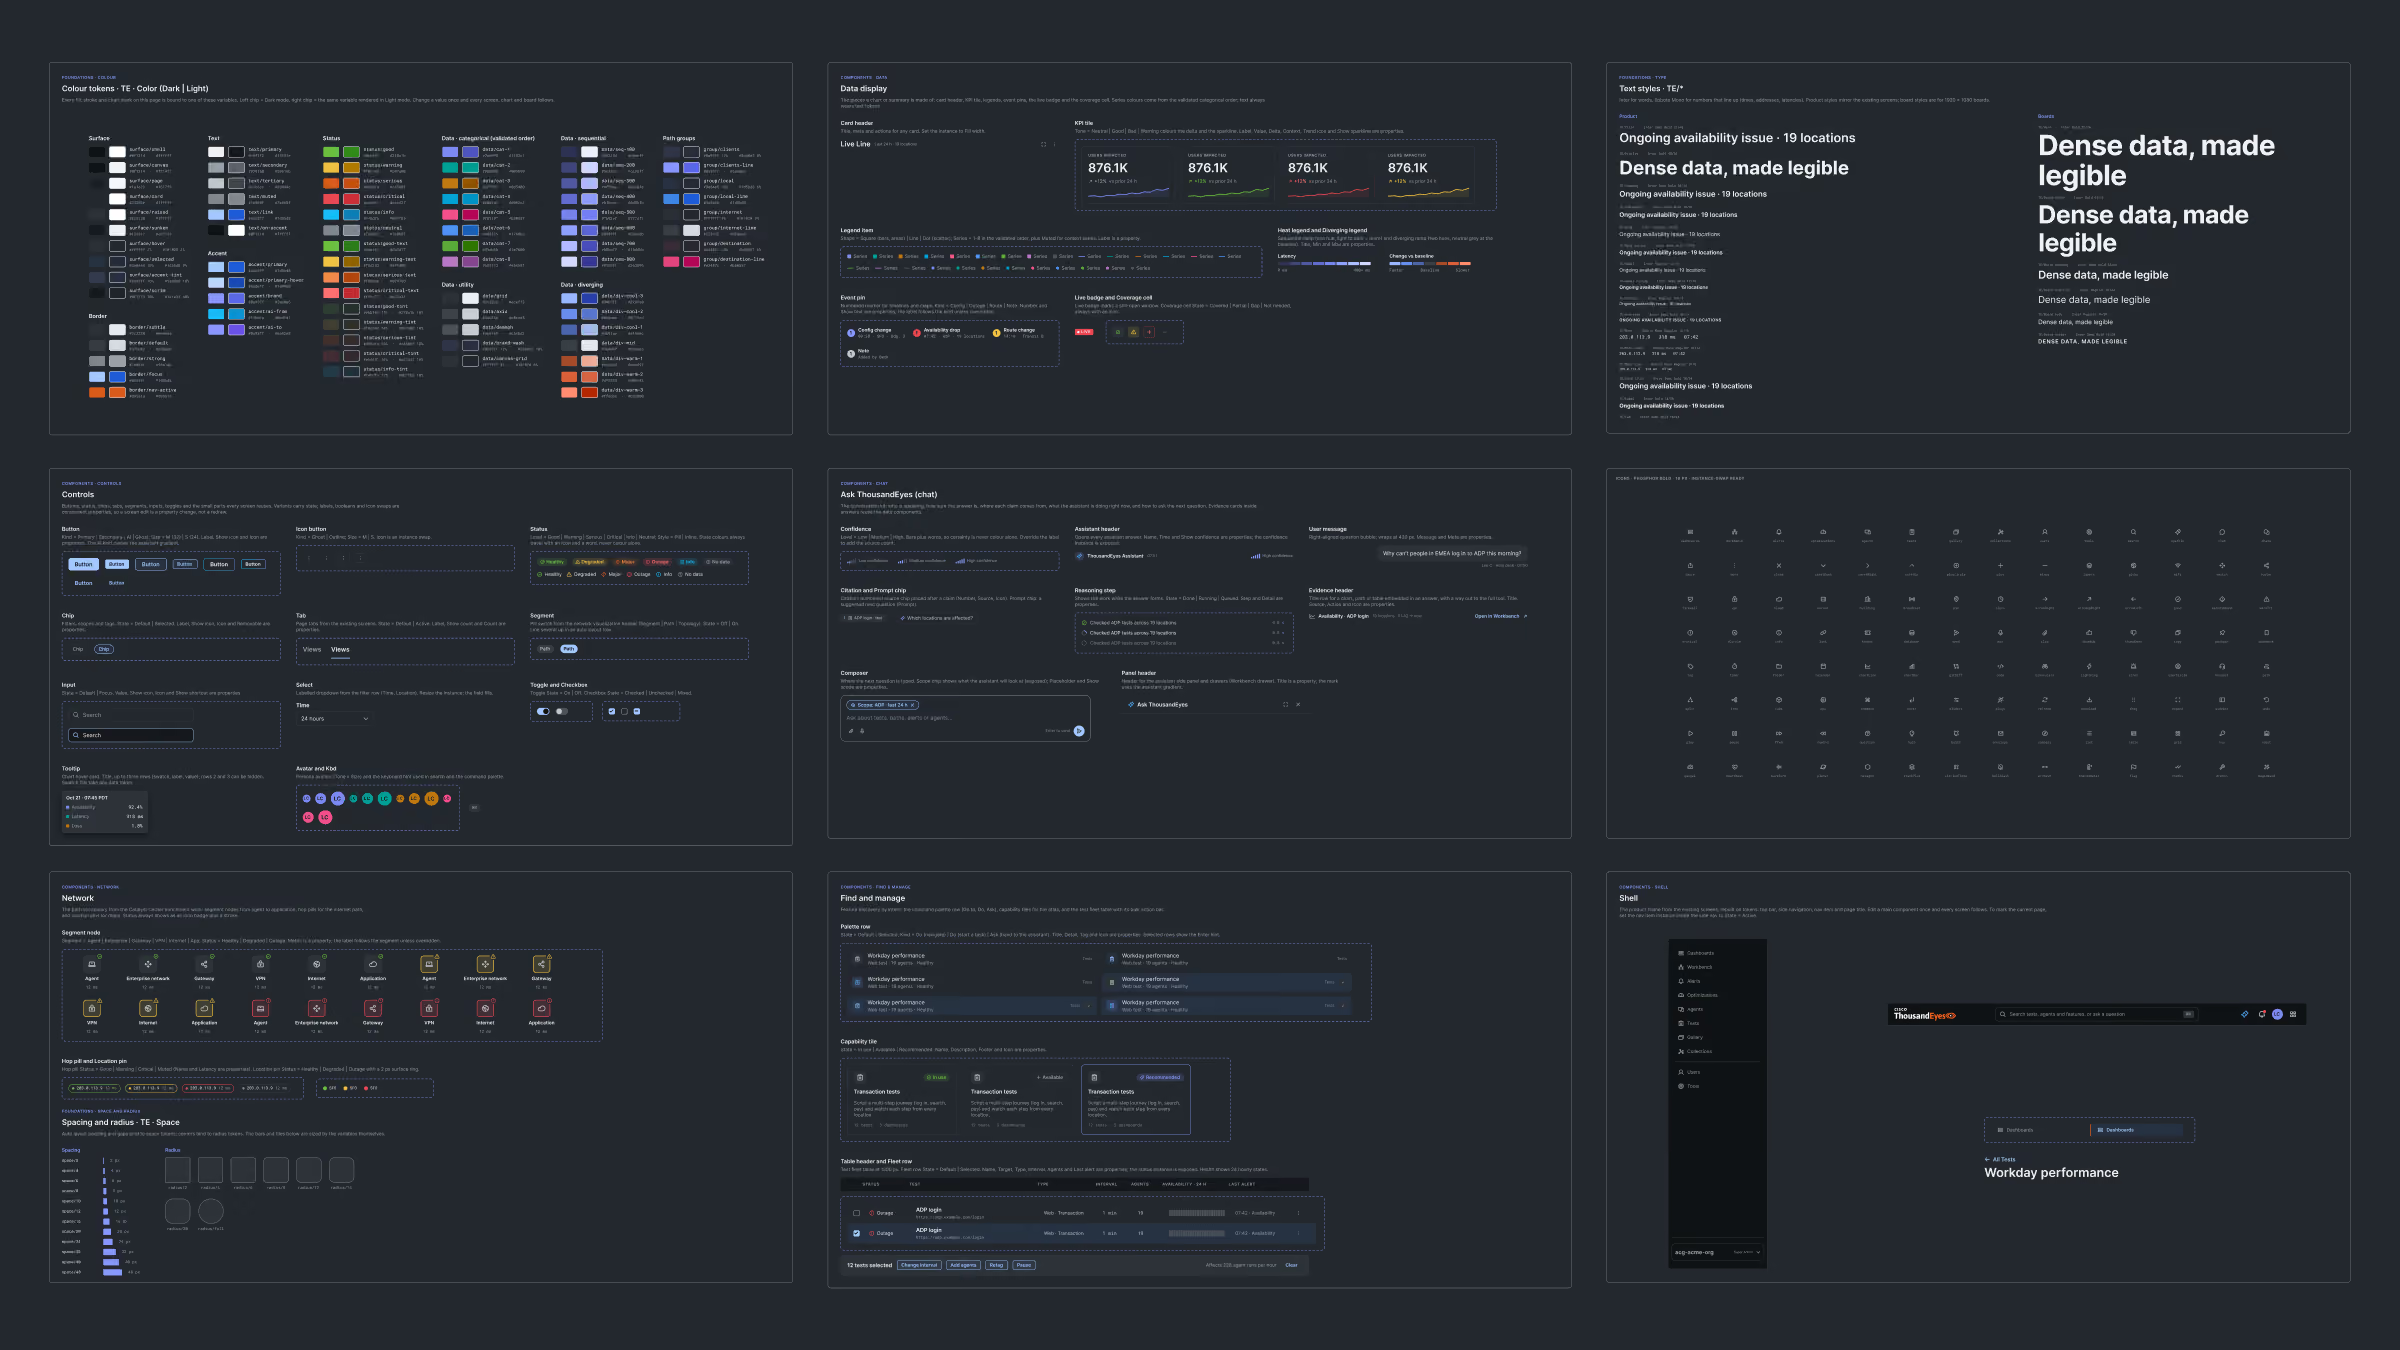
A dark-themed digital dashboard overview with nine panels displaying various data visualizations, metrics, charts, and interface elements including charts, color-coded indicators, text blocks, and menu options arranged in a 3x3 grid layout.
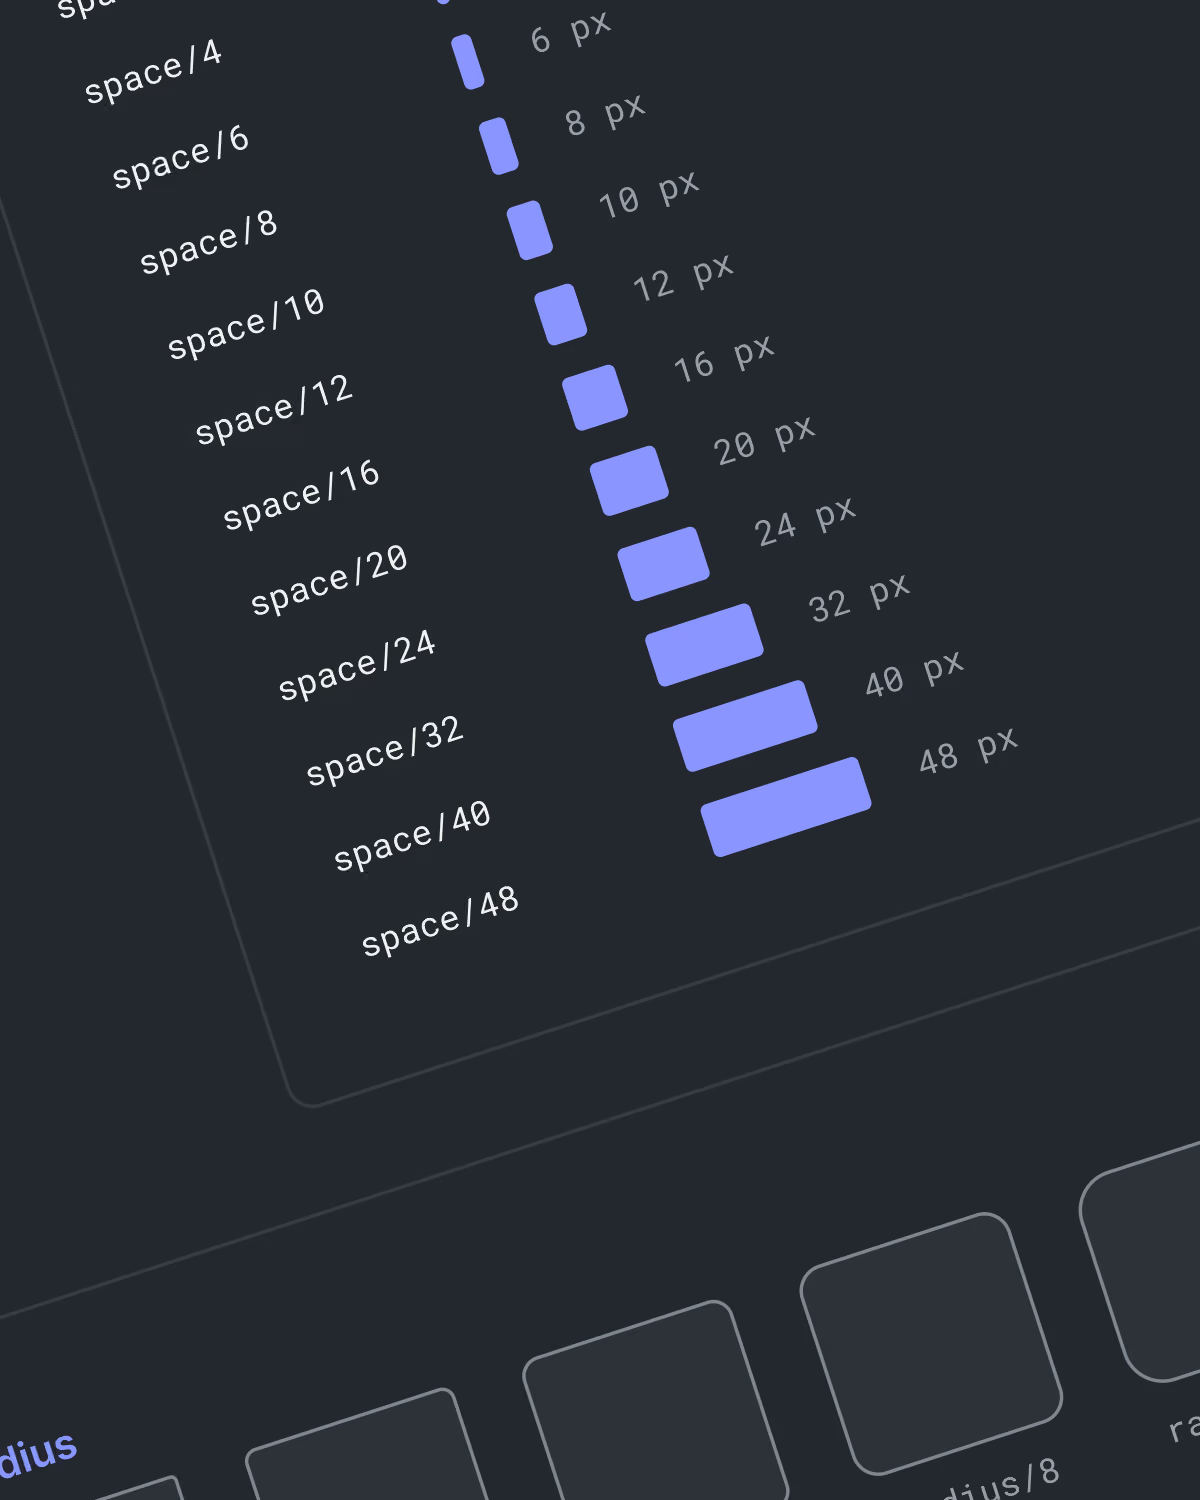
Design system interface showing a vertical scale of labeled spacing units from space/4 to space/48 with corresponding pixel sizes from 6 px to 48 px represented by blue rectangular bars of increasing length.
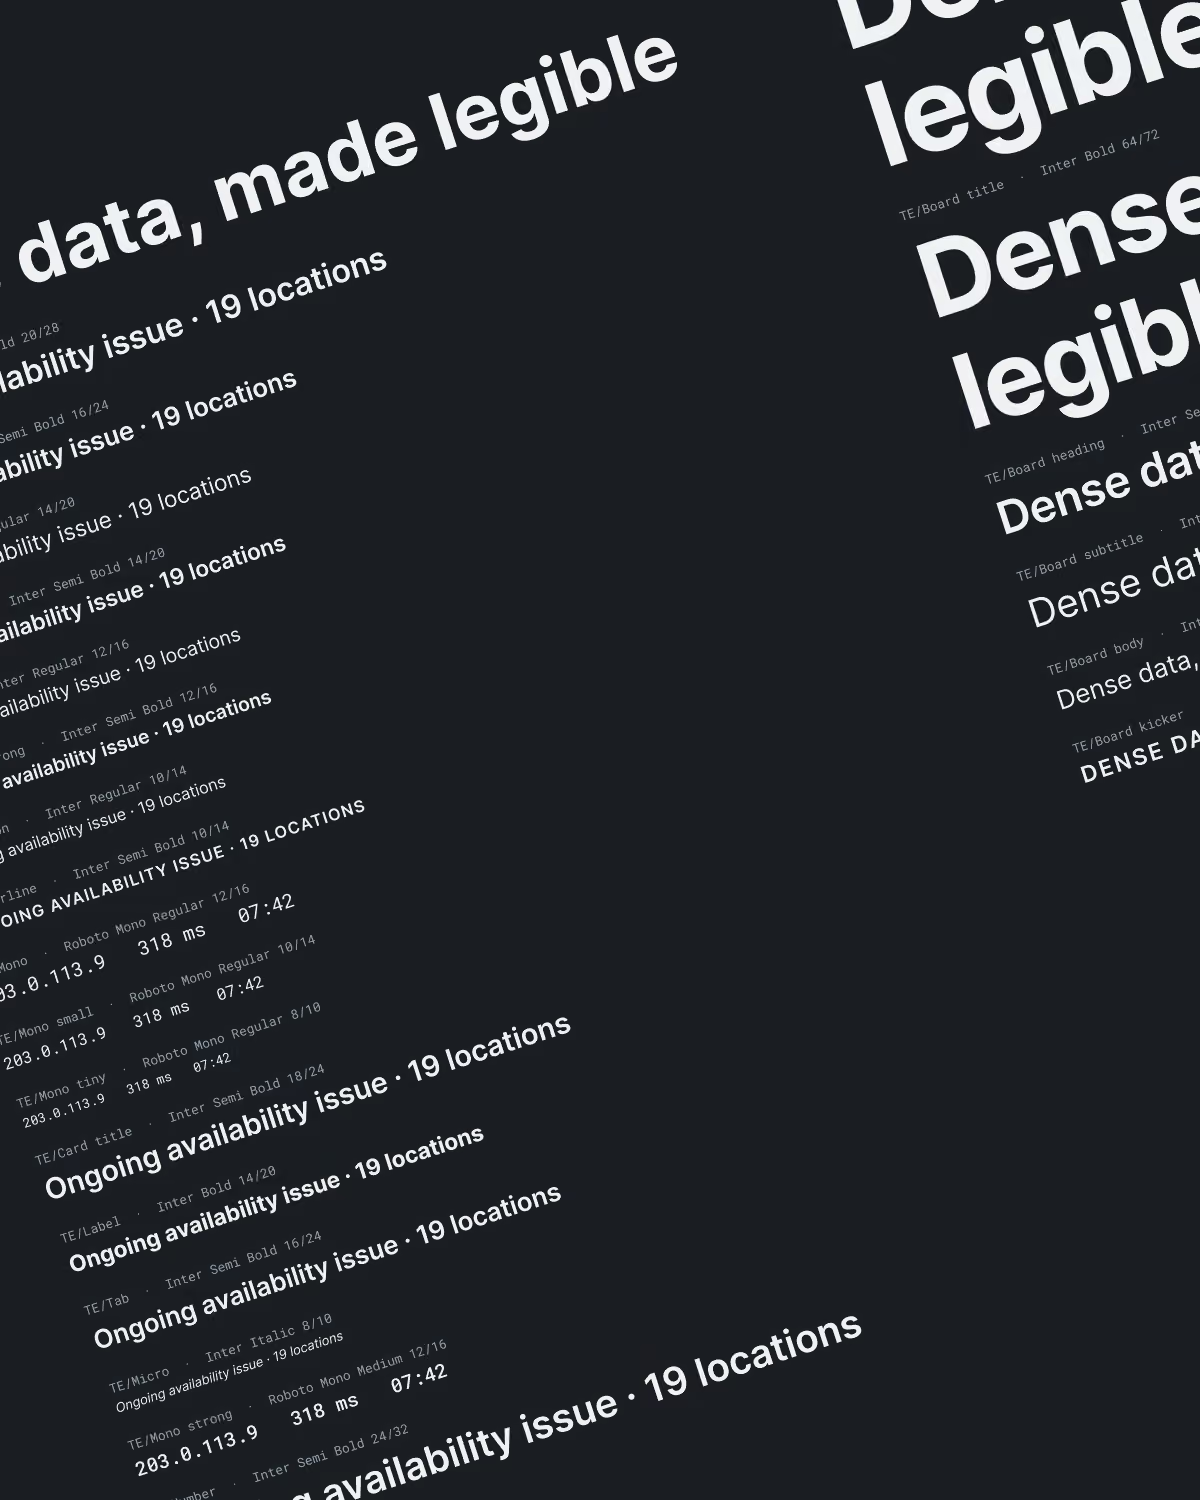
Black background with white text samples in various font styles and sizes arranged diagonally, demonstrating the phrase 'Ongoing availability issue · 19 locations' and other typography examples for headings and body text.
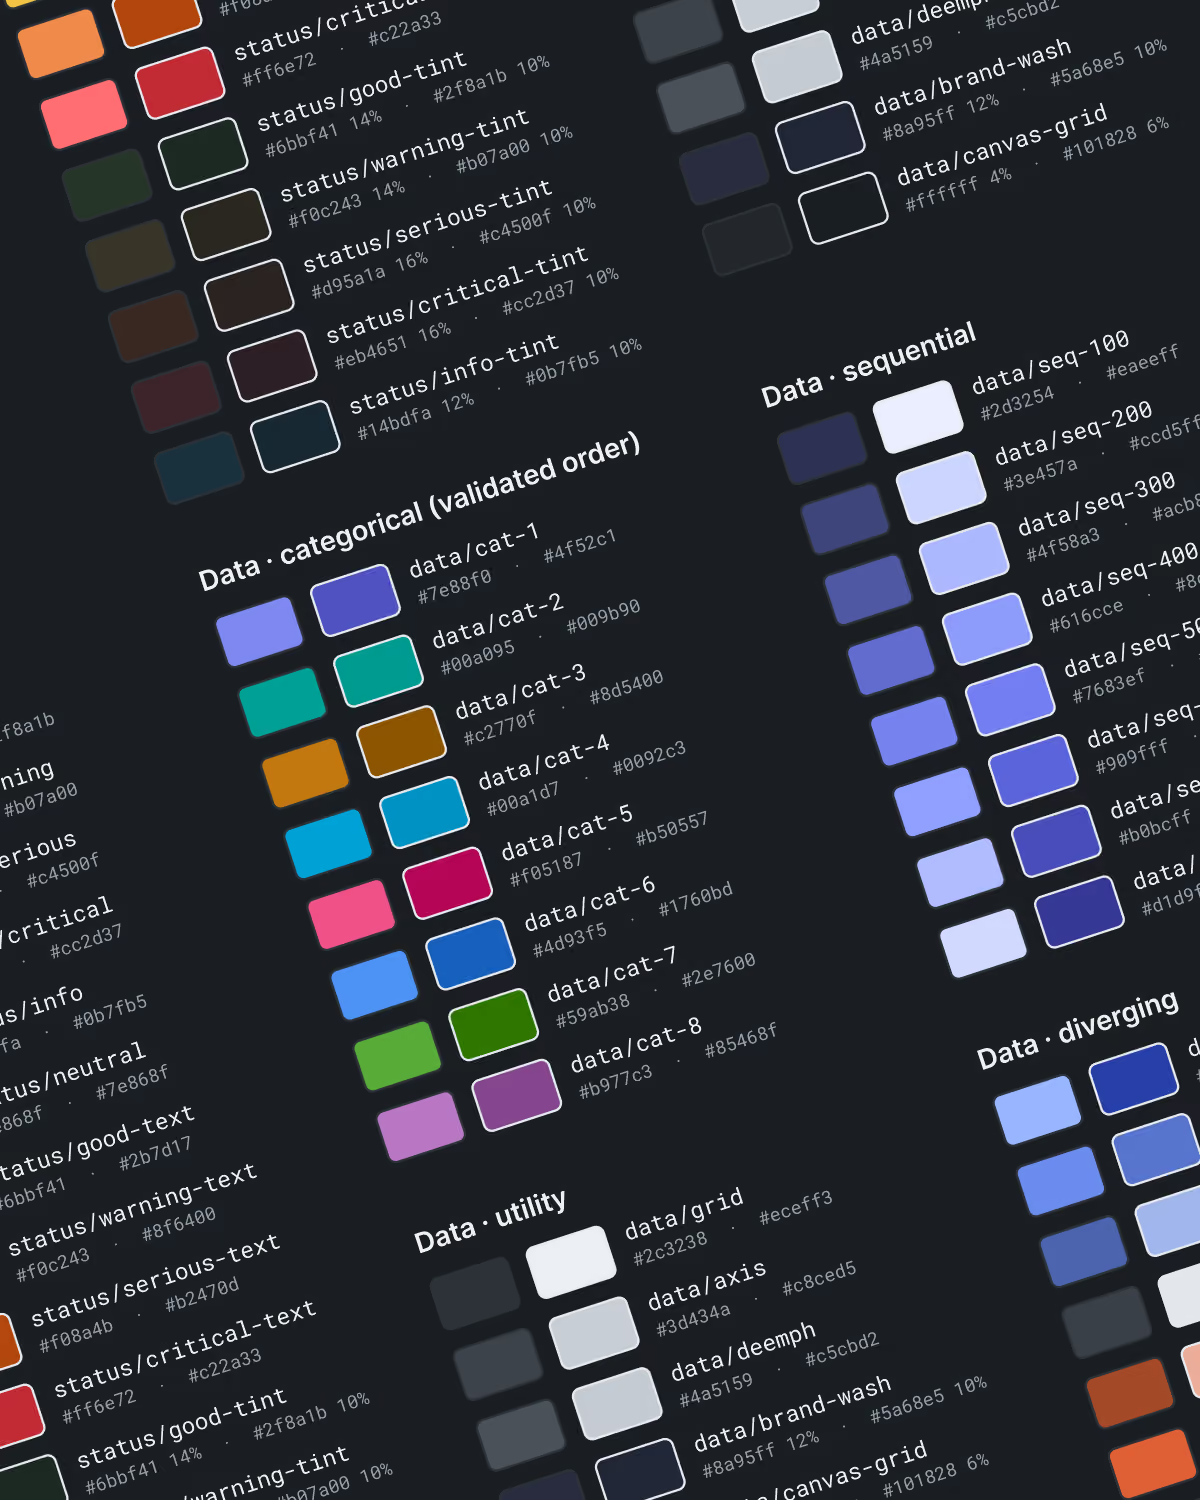
Color palette chart showing categorized data color swatches with hex codes and percentages for categories: status (critical, good-tint, warning-tint, serious-tint, critical-tint, info-tint), data categorical with eight labeled color blocks, data sequential with varying shades of blue and purple, data utility grays and whites, and data diverging color blocks in blue, orange, and red tones.
Data visualization

Data that explains itself

Data visualization is how complex information gets understood quickly. We created fresh, rich visualizations that package the who, what, when, where and why at a glance.

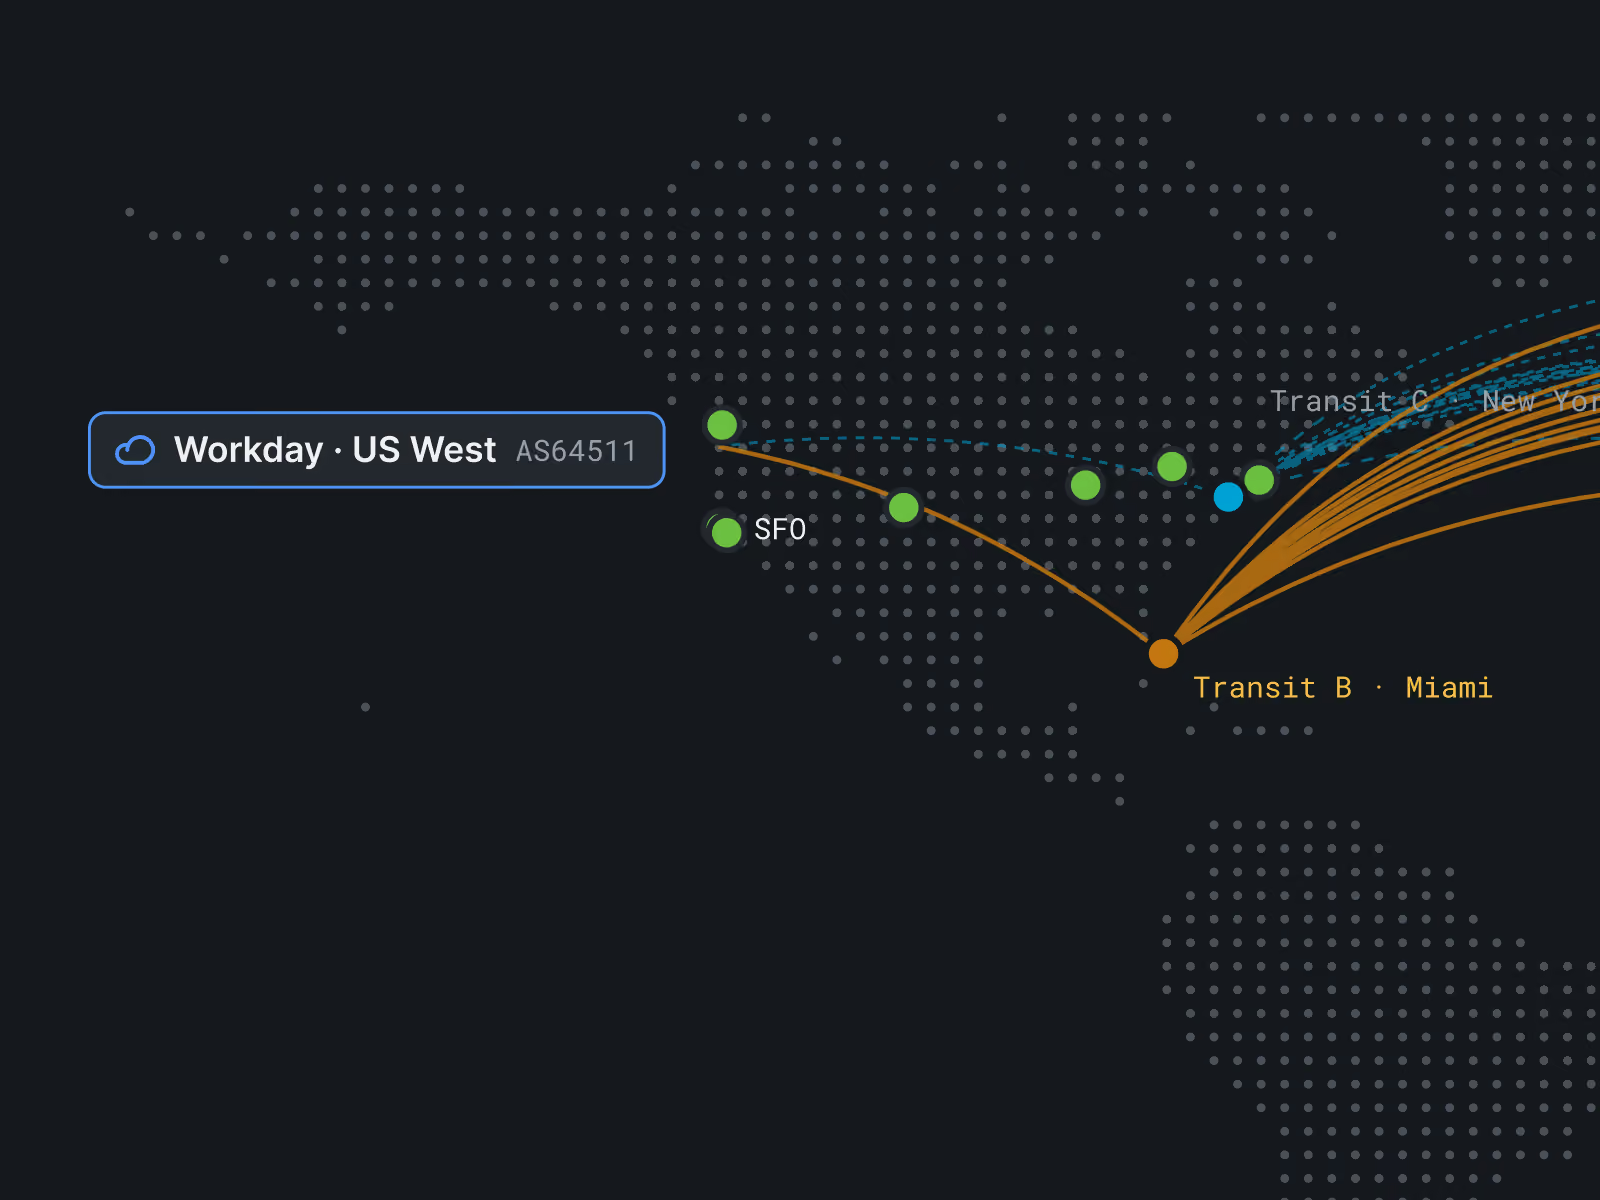
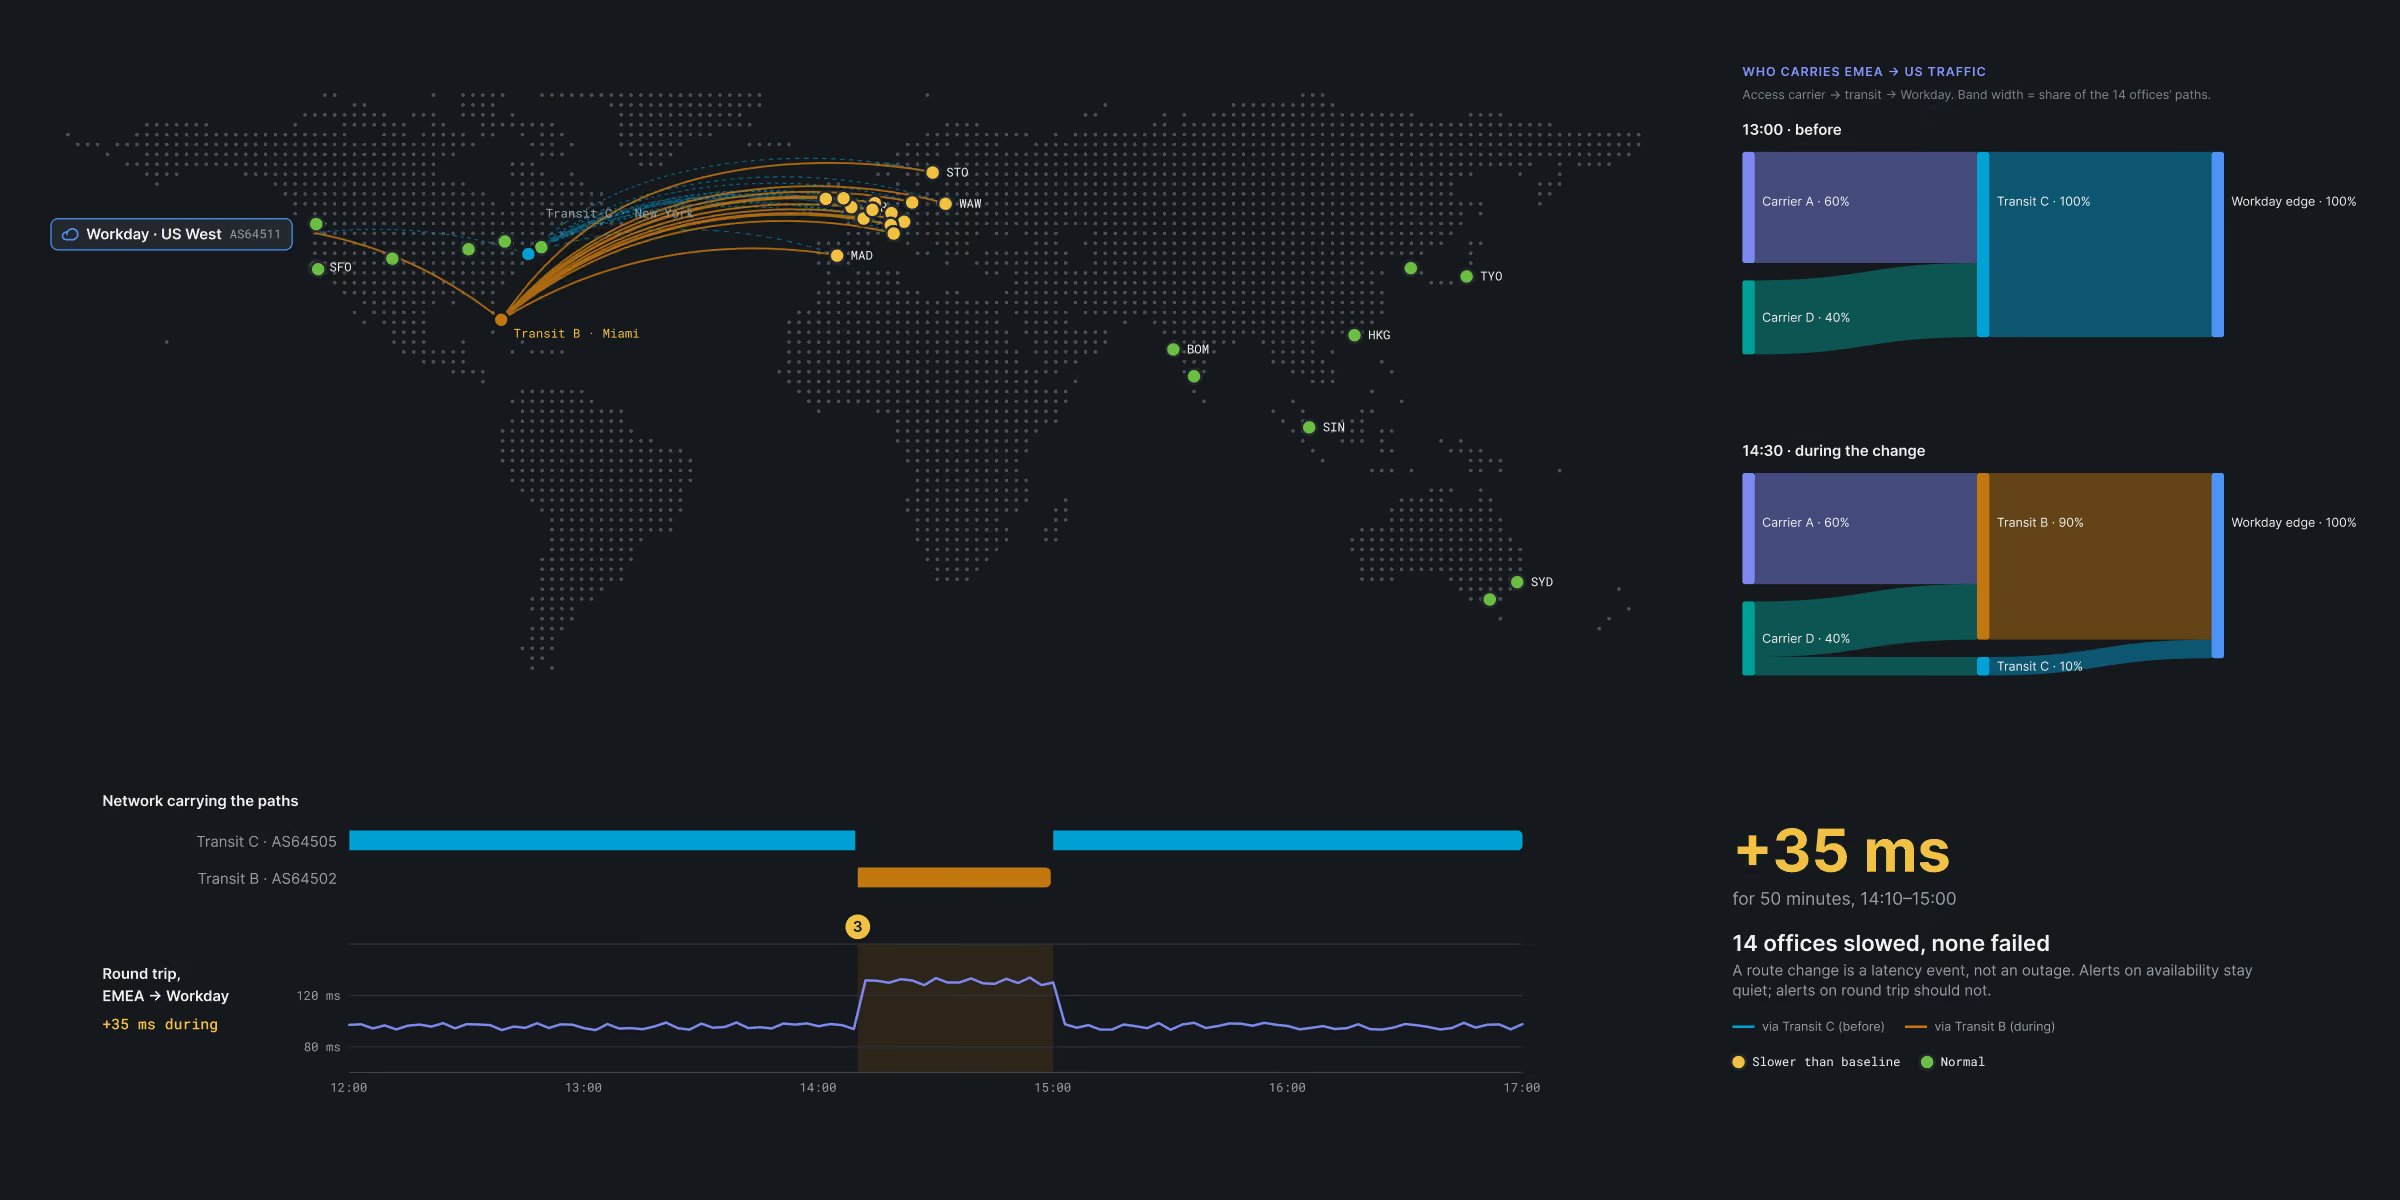
Dark-themed world map showing network paths from US West to various global locations with colored lines and dots representing transit paths and nodes. On the right, two bar charts compare US traffic share before and during a change, highlighting shifts among Carrier A, B, and C, and Workday edge maintaining 100%. Below, a line graph shows round trip latency with an increase of 35 milliseconds during 14:10 to 15:00, marking network performance slowdown. Legend indicates transit C and B status and latency thresholds.
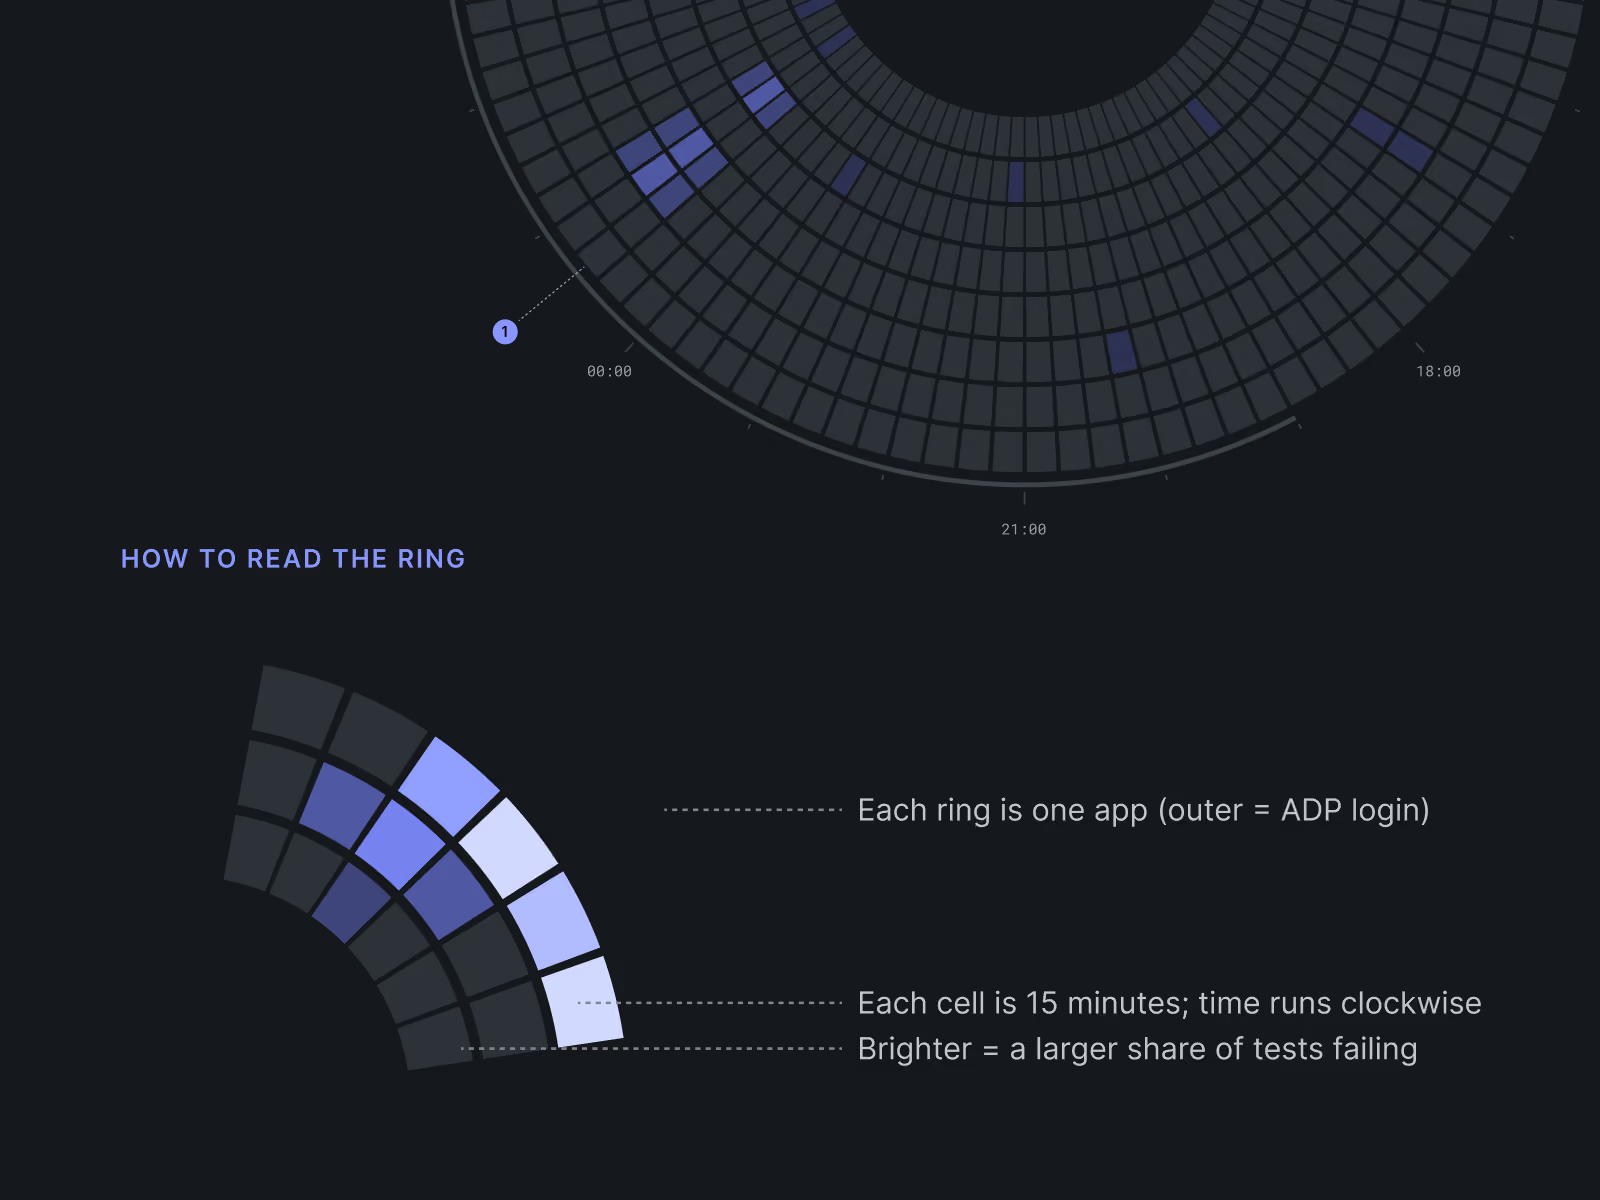
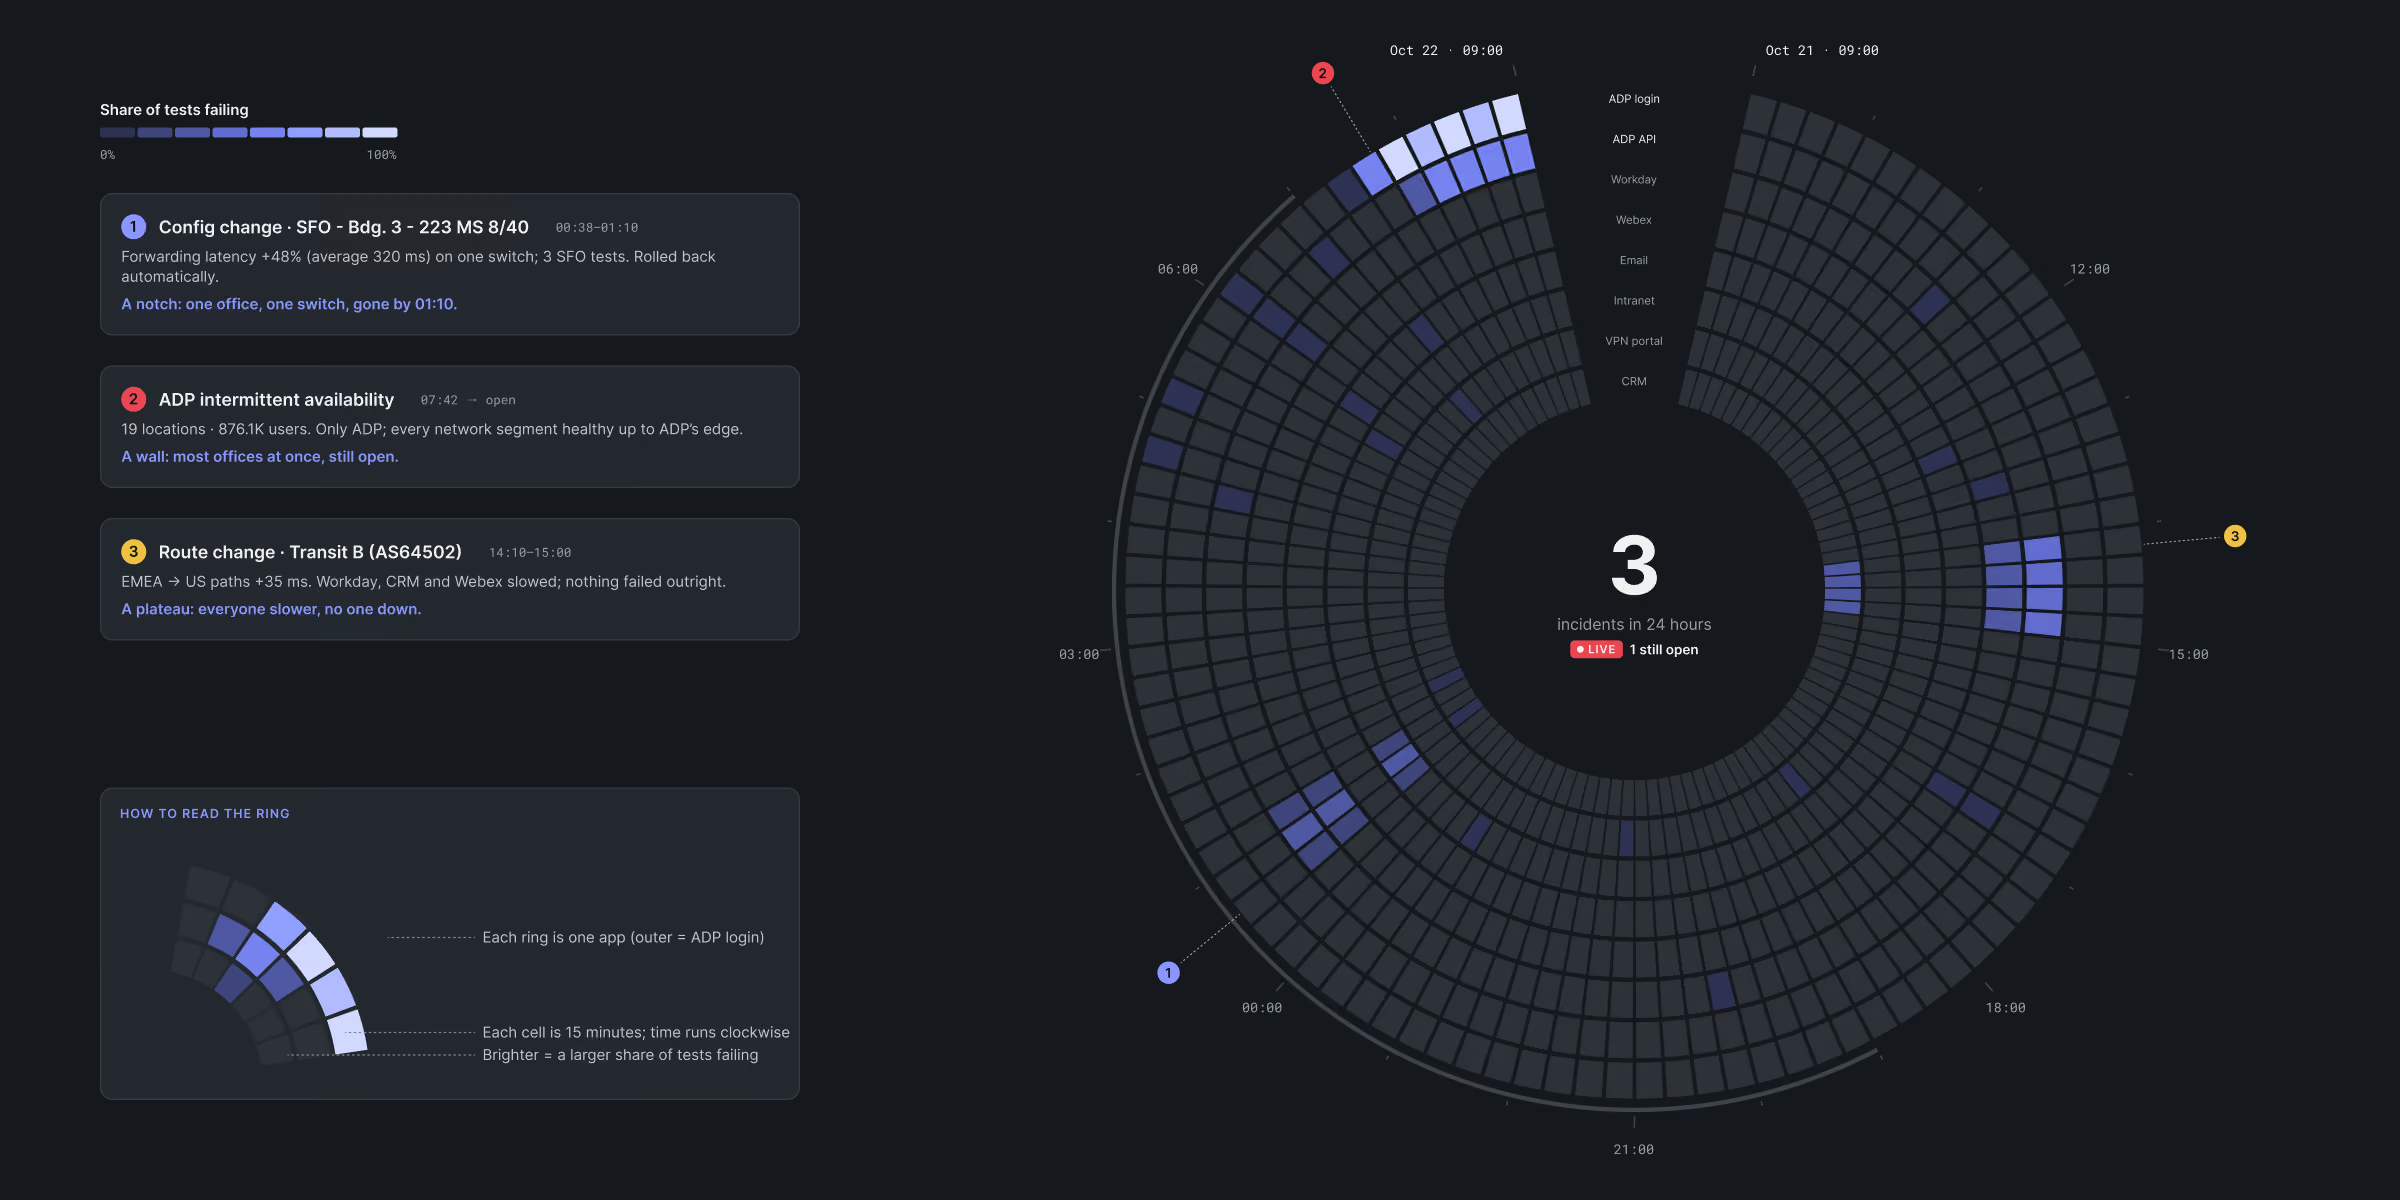
Circular data visualization showing app test failures over time in rings; outer ring labeled as ADP login. A section explains how to read the ring: each ring represents one app, each cell covers 15 minutes moving clockwise, and brightness indicates the share of tests failing. Time labels 00:00, 18:00, and 21:00 appear around the ring.
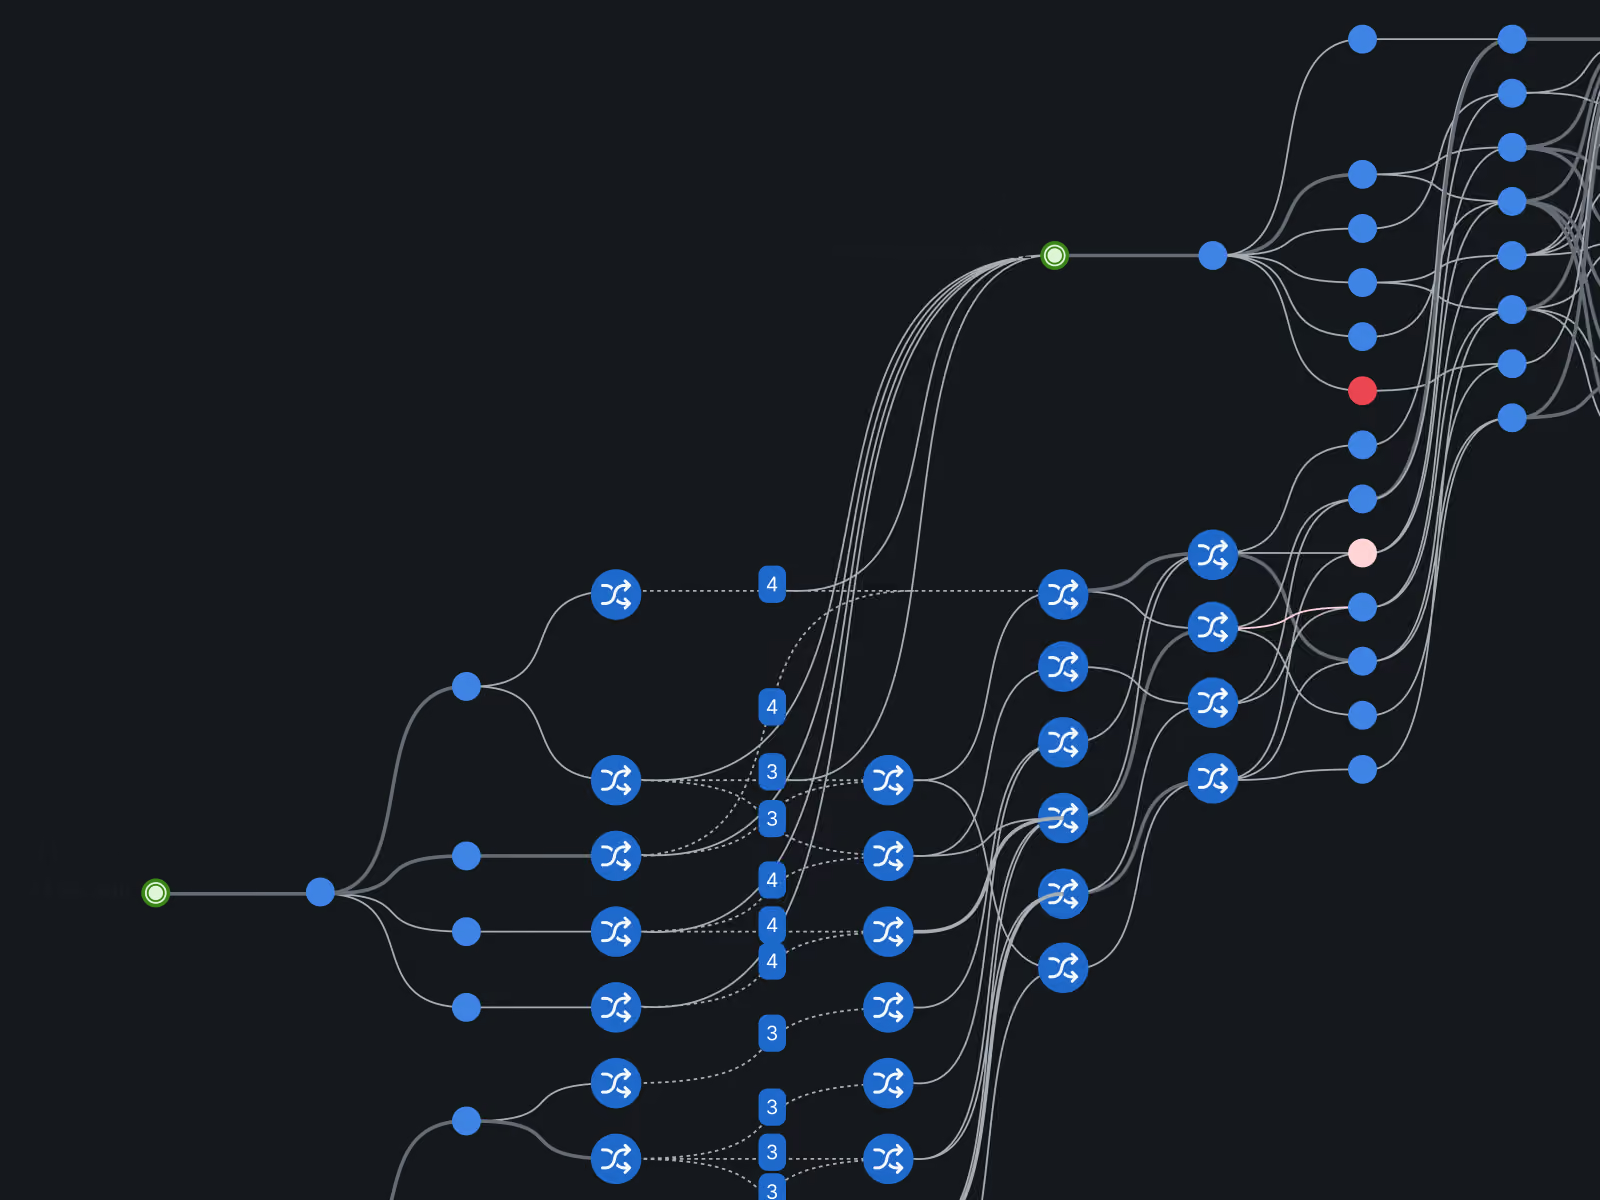
Complex network graph with multiple interconnected nodes represented by blue circular icons, connected by curved lines on a dark background, showing branching paths and clusters.
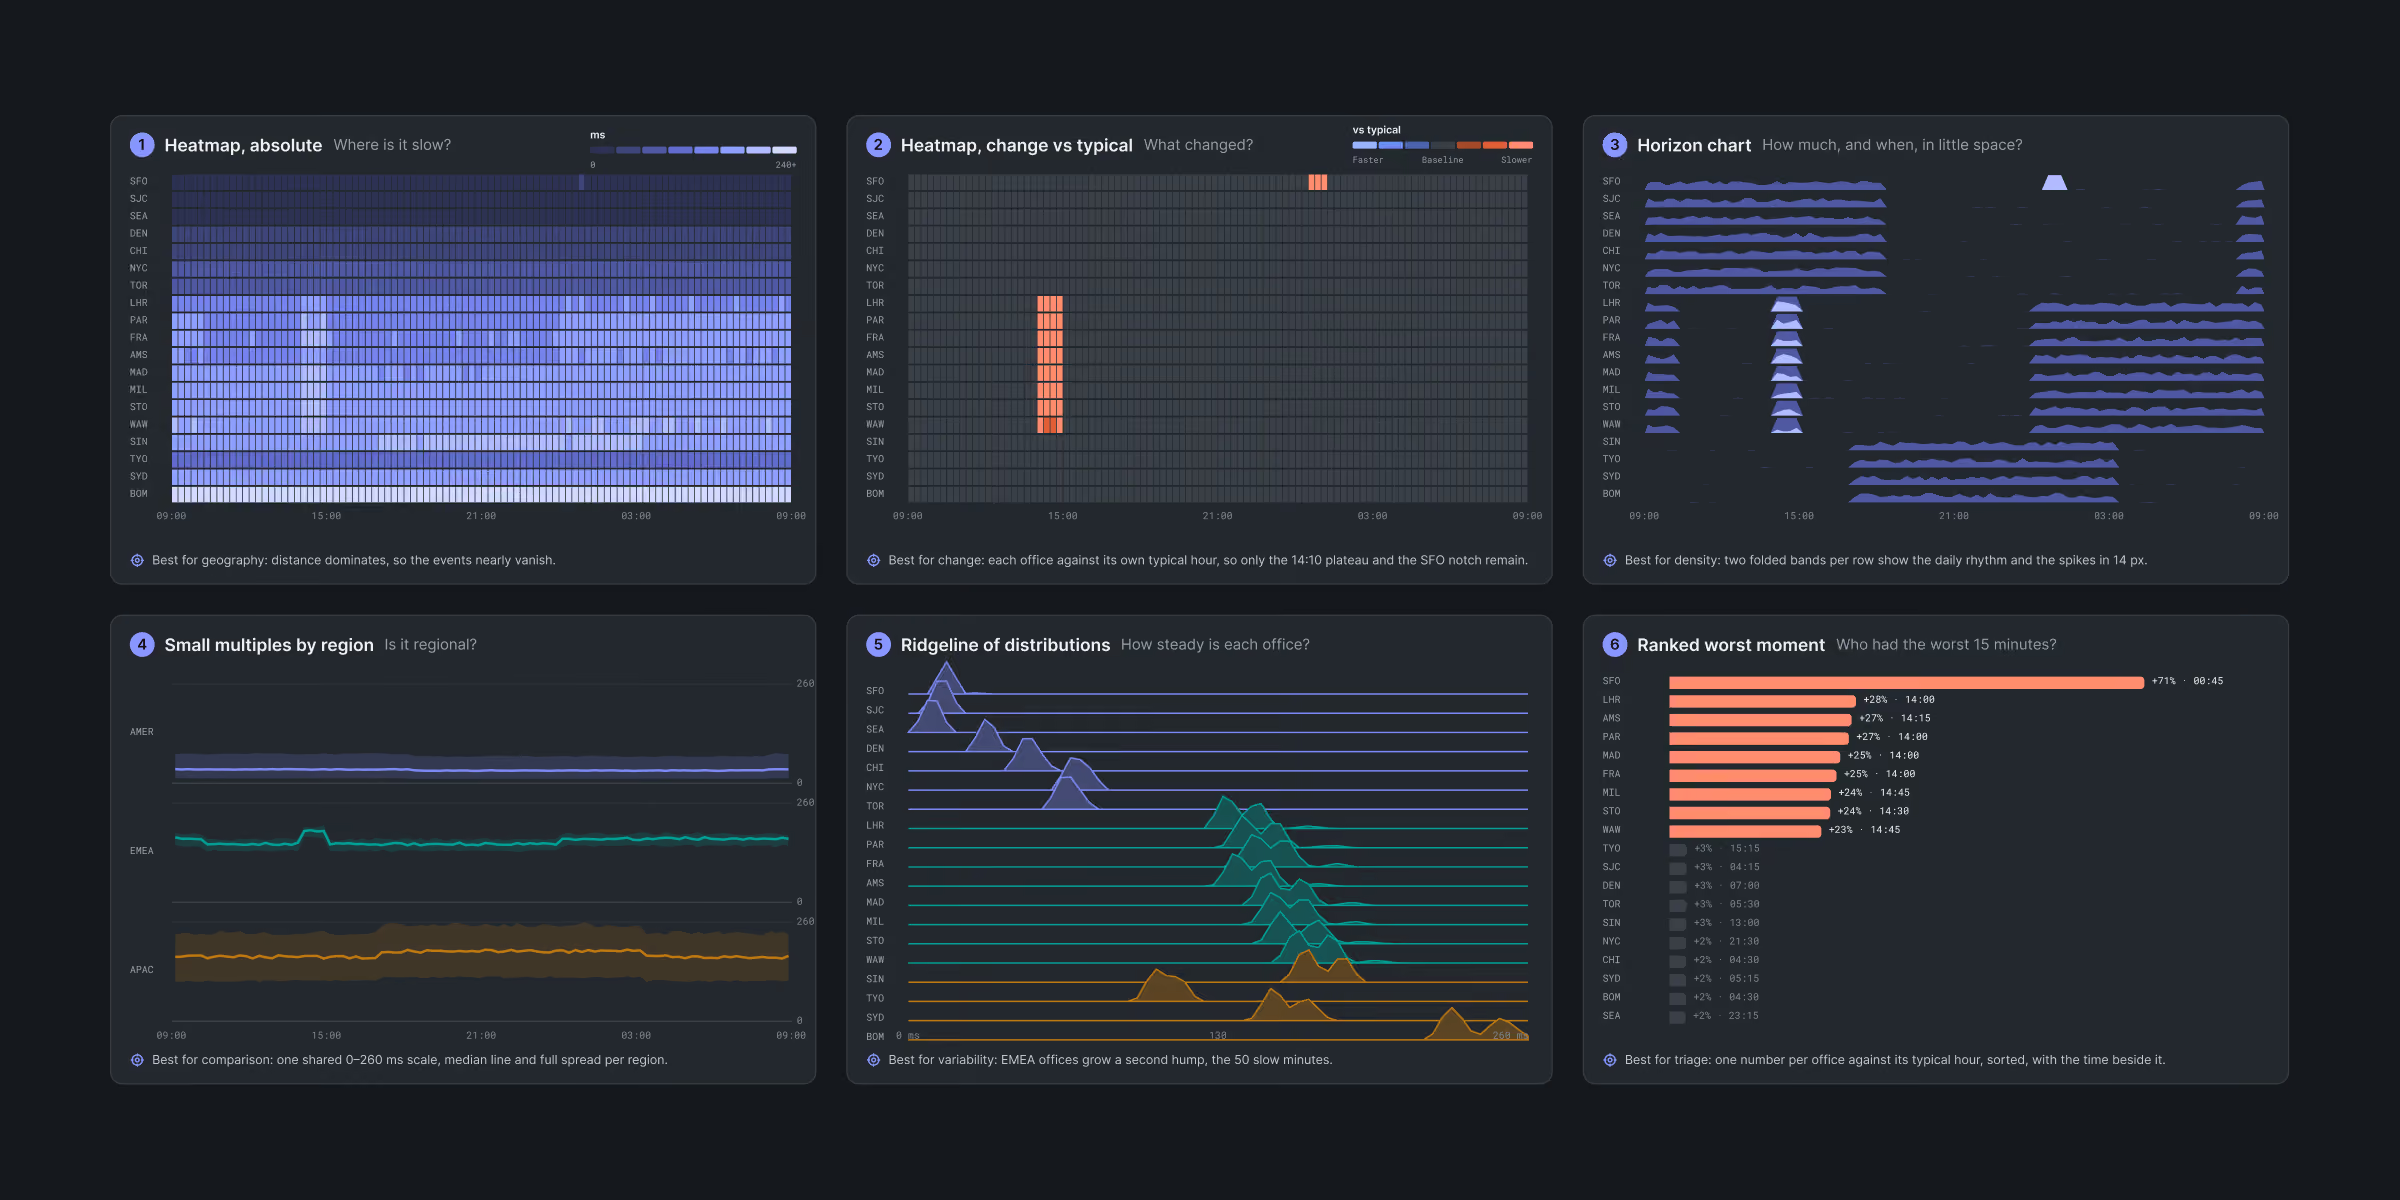
Six data visualizations showing metrics across regions and time: 1) Absolute heatmap with blue gradient by geography and time. 2) Heatmap highlighting changes against typical patterns in orange. 3) Horizon chart showing density and time with blue layered bands. 4) Line chart of small multiples by region with three colored lines over time. 5) Ridgeline distributions with purple, teal, and brown mountain plots for variability over 50 minutes. 6) Ranked worst moment bar chart with orange bars listing top 15 worst times. Each chart includes axes and explanatory notes.
A dark world map with dotted outlines showing network connections from a node labeled 'Workday US West AS64511' near the west coast of the United States to nodes including 'SFO' and 'Transit B Miami' with yellow and blue lines indicating data routes.
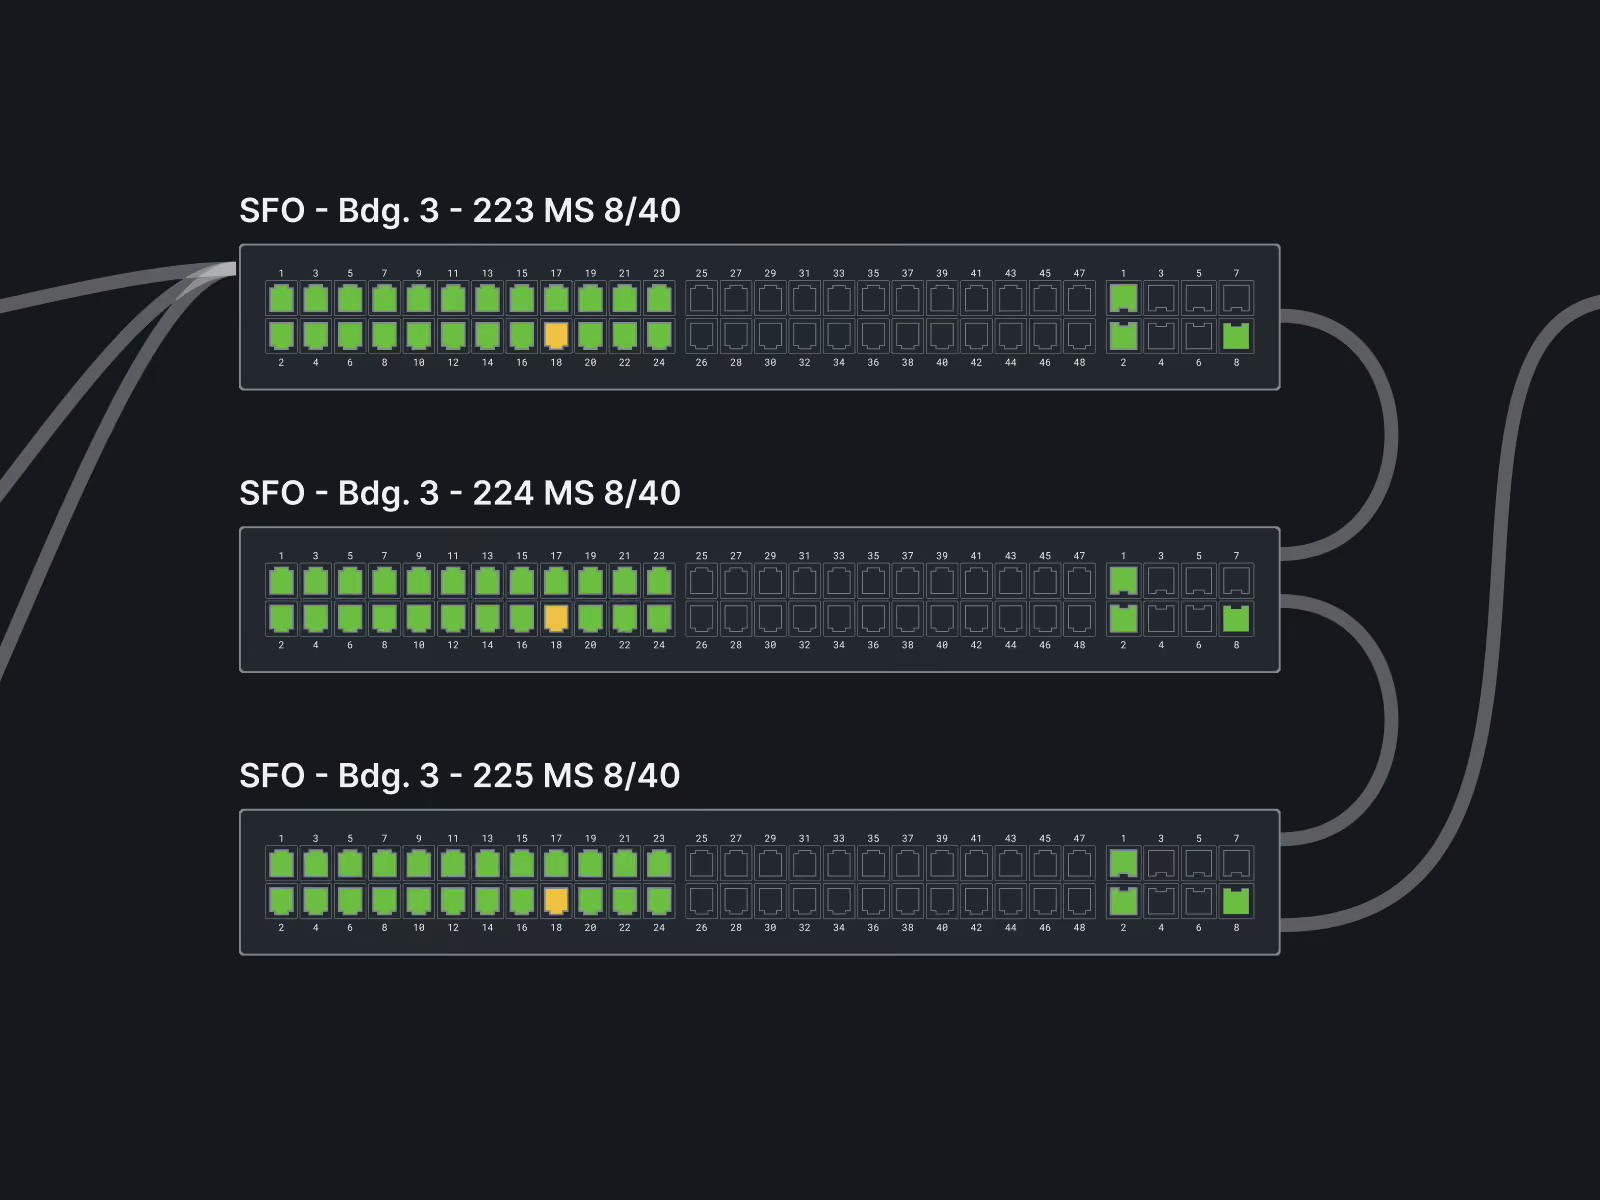
Three labeled racks representing SFO Building 3 with identifiers 223, 224, and 225 MS 8/40, each showing a series of numbered ports. Most ports are illuminated green, with some in the middle lit orange, and others unlit in a dark setting, with cables connected to right side ports.
Circular ring chart showing share of tests failing over a 24-hour period with segments representing different apps and times; center indicates 3 incidents in 24 hours with 1 still open. On the left, text boxes describe three issues: config change causing latency and automatic rollback, ADP intermittent availability affecting network health, and route change with slower but no outage. A legend explains ring segments and brightness indicating share of tests failing.
Wearables and mobile

Answers beyond the desk

Nobody watches a network from a desk all day. We designed for the phone and the wrist, so the answer would reach people wherever they are.

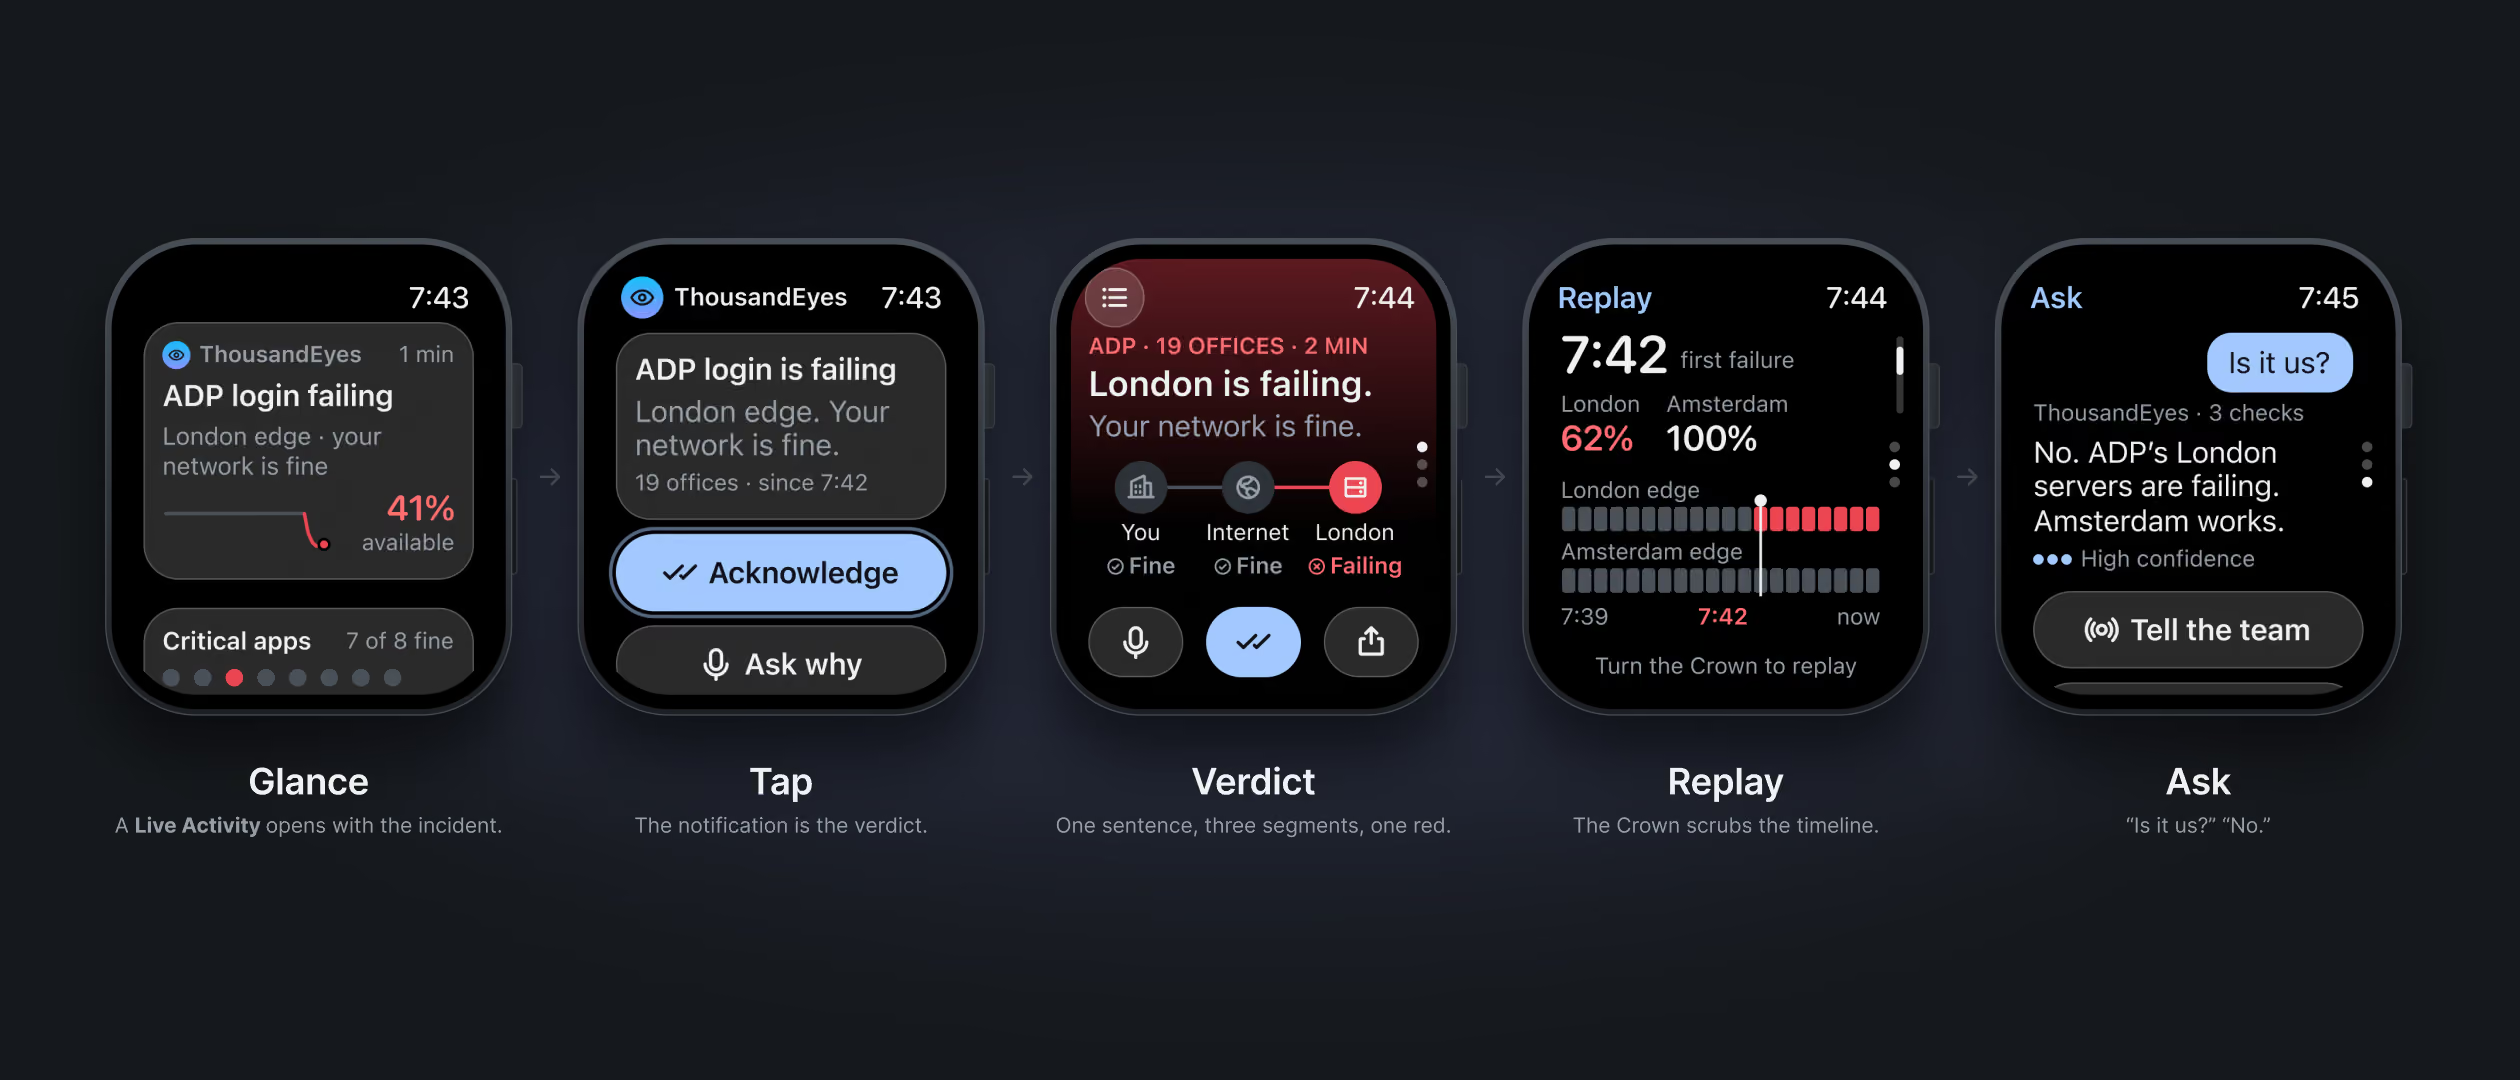
A sequence of five smartwatch screens showing a network incident workflow: 1) Glance screen displays 'ADP login failing' with network fine and 41% availability. 2) Tap screen shows notification with options 'Acknowledge' and 'Ask why.' 3) Verdict screen indicates London is failing with network fine for user and internet, but failing for London. 4) Replay screen presents timeline data with failure at 7:42 in London edge but Amsterdam at 100%. 5) Ask screen has a chat message 'Is it us?' with a reply confirming ADP's London servers are failing, Amsterdam works, and an option to 'Tell the team.' Captions below describe each step.
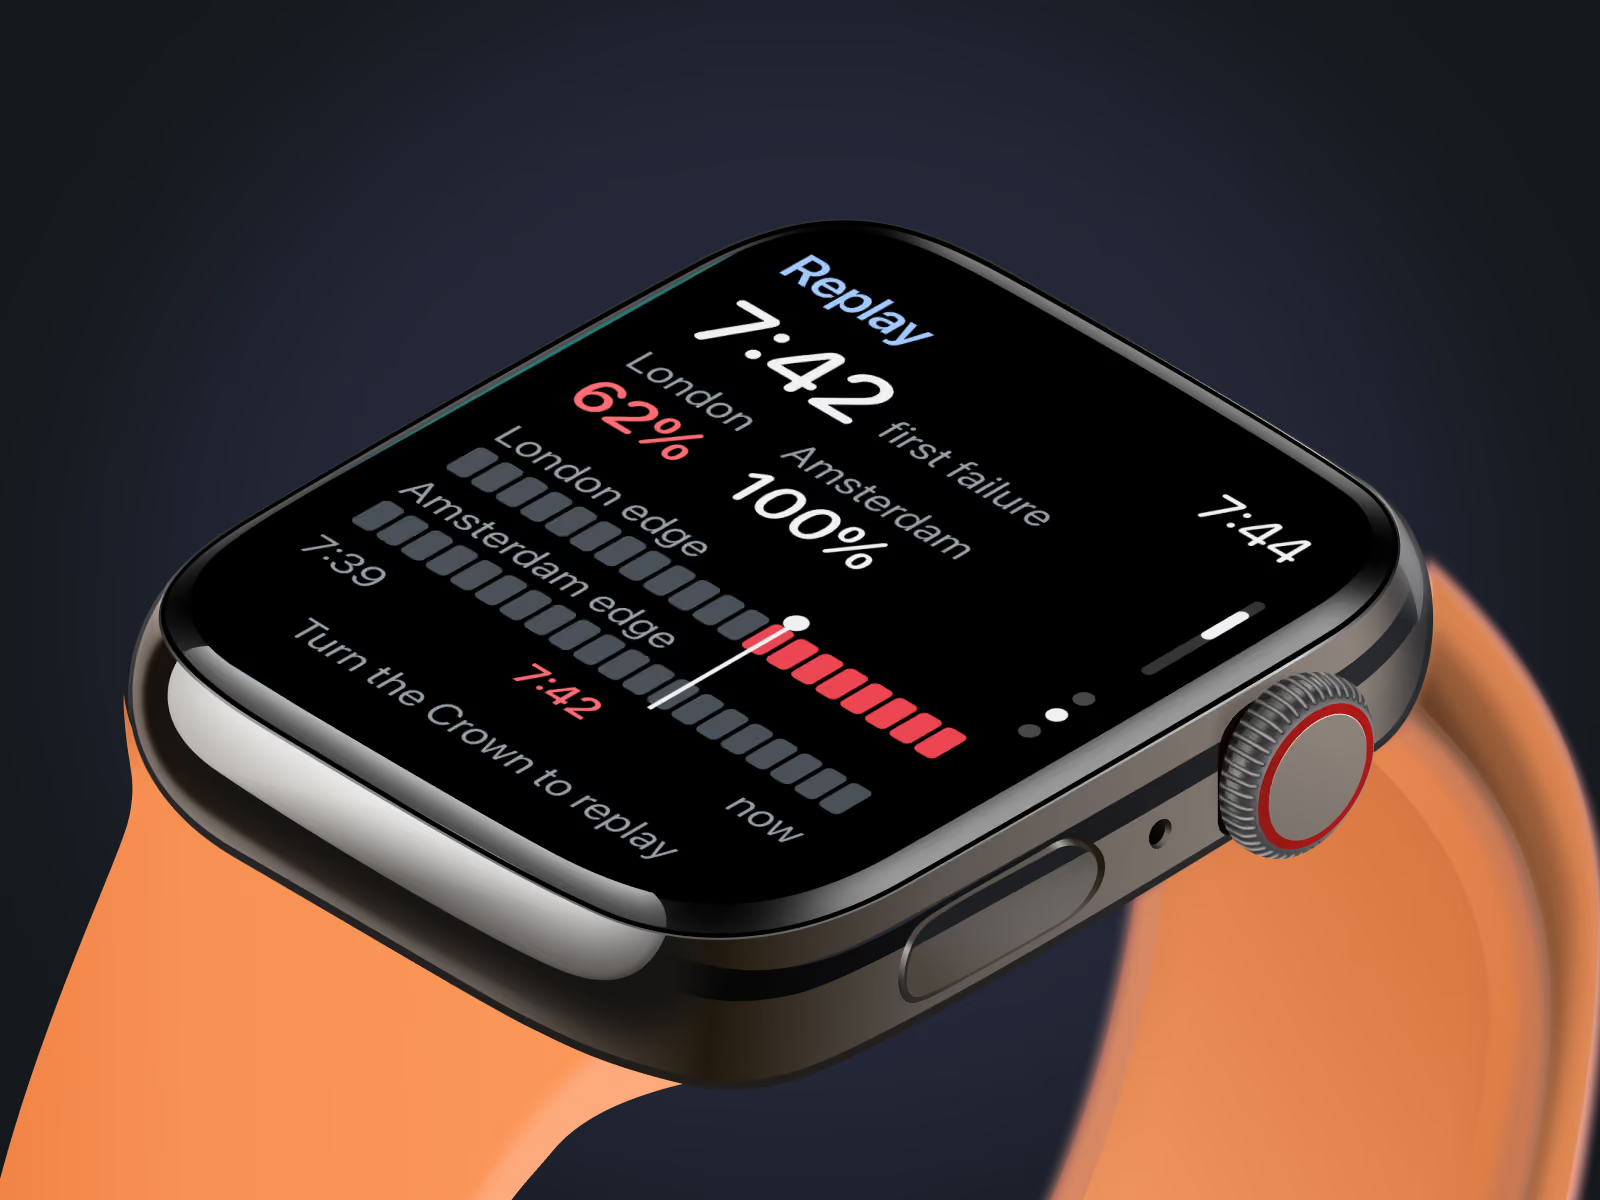
Close-up of a smartwatch with an orange band displaying a replay screen showing network status for London and Amsterdam with percentages 62% and 100%, timestamps 7:39, 7:42, and 7:44, and a timeline with colored bars and a prompt to turn the crown to replay.
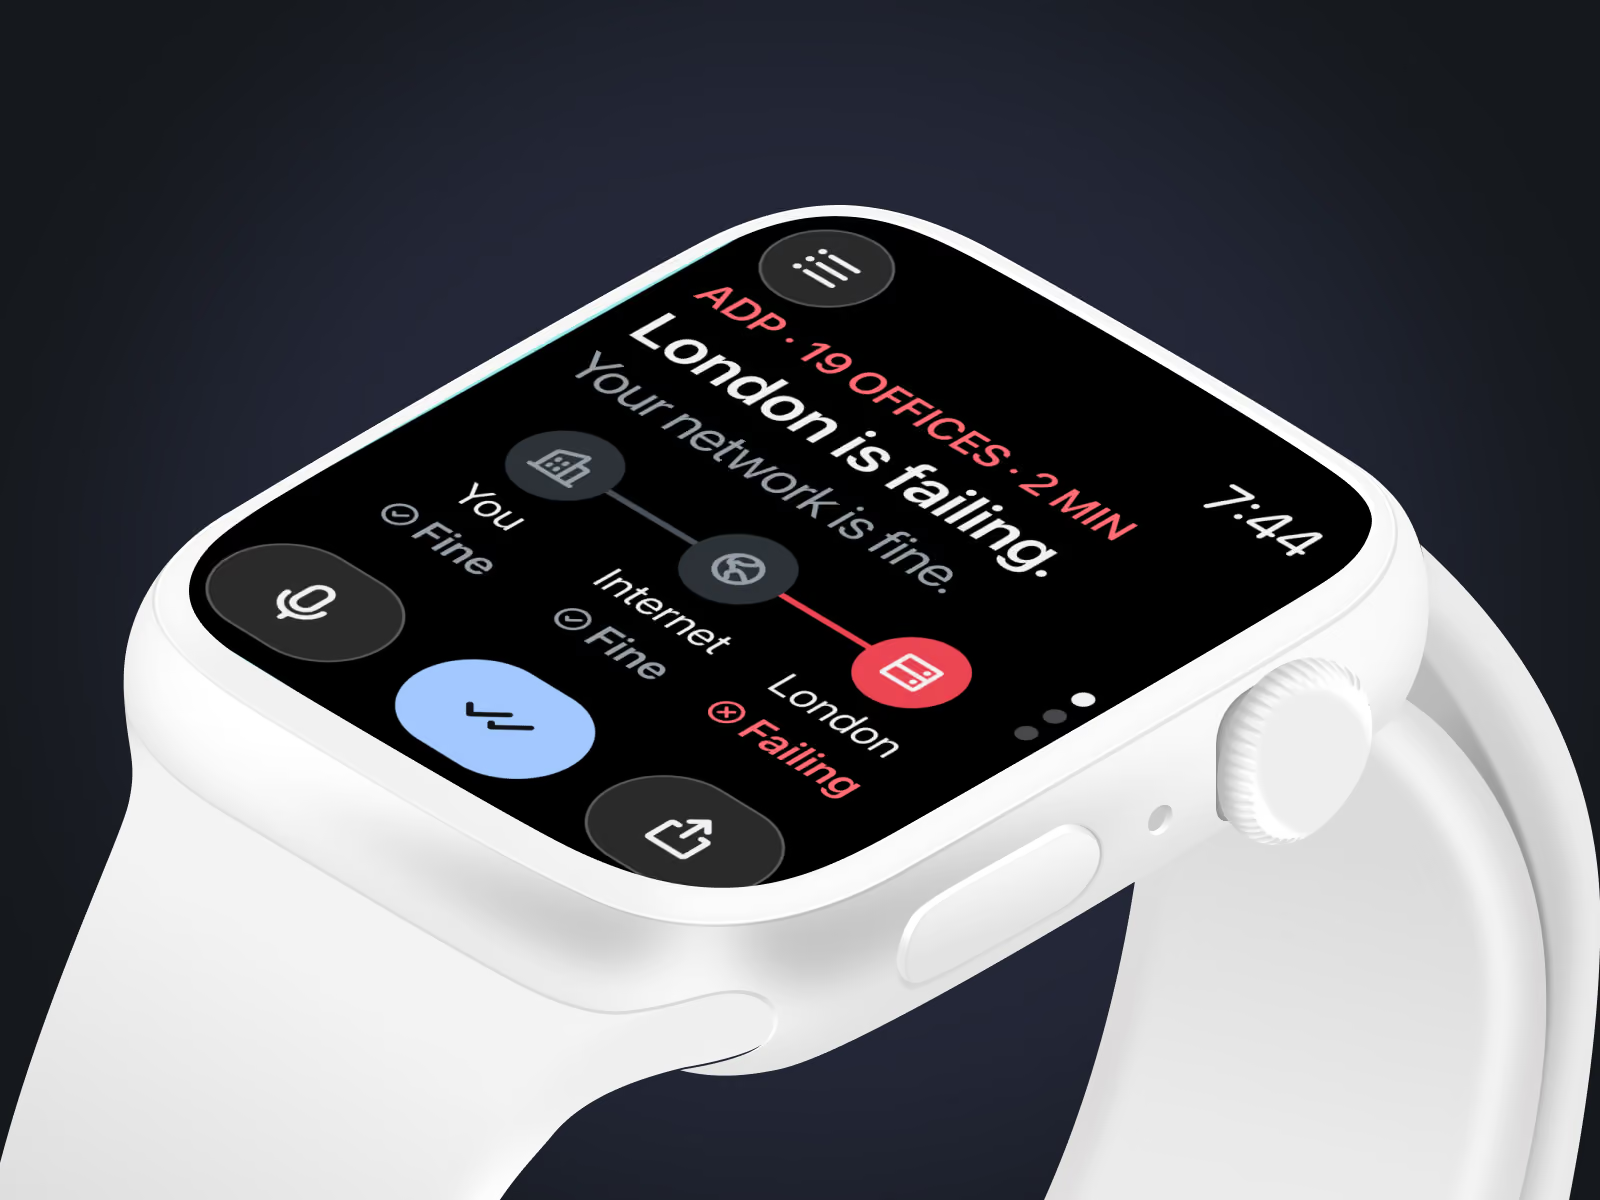
Close-up of a white smartwatch displaying a network monitoring app screen that shows 'London is failing' in red text with a failing status icon, a network path from 'You' to 'Internet' is fine, but the path to 'London' is failing, and the time displayed is 7:44.
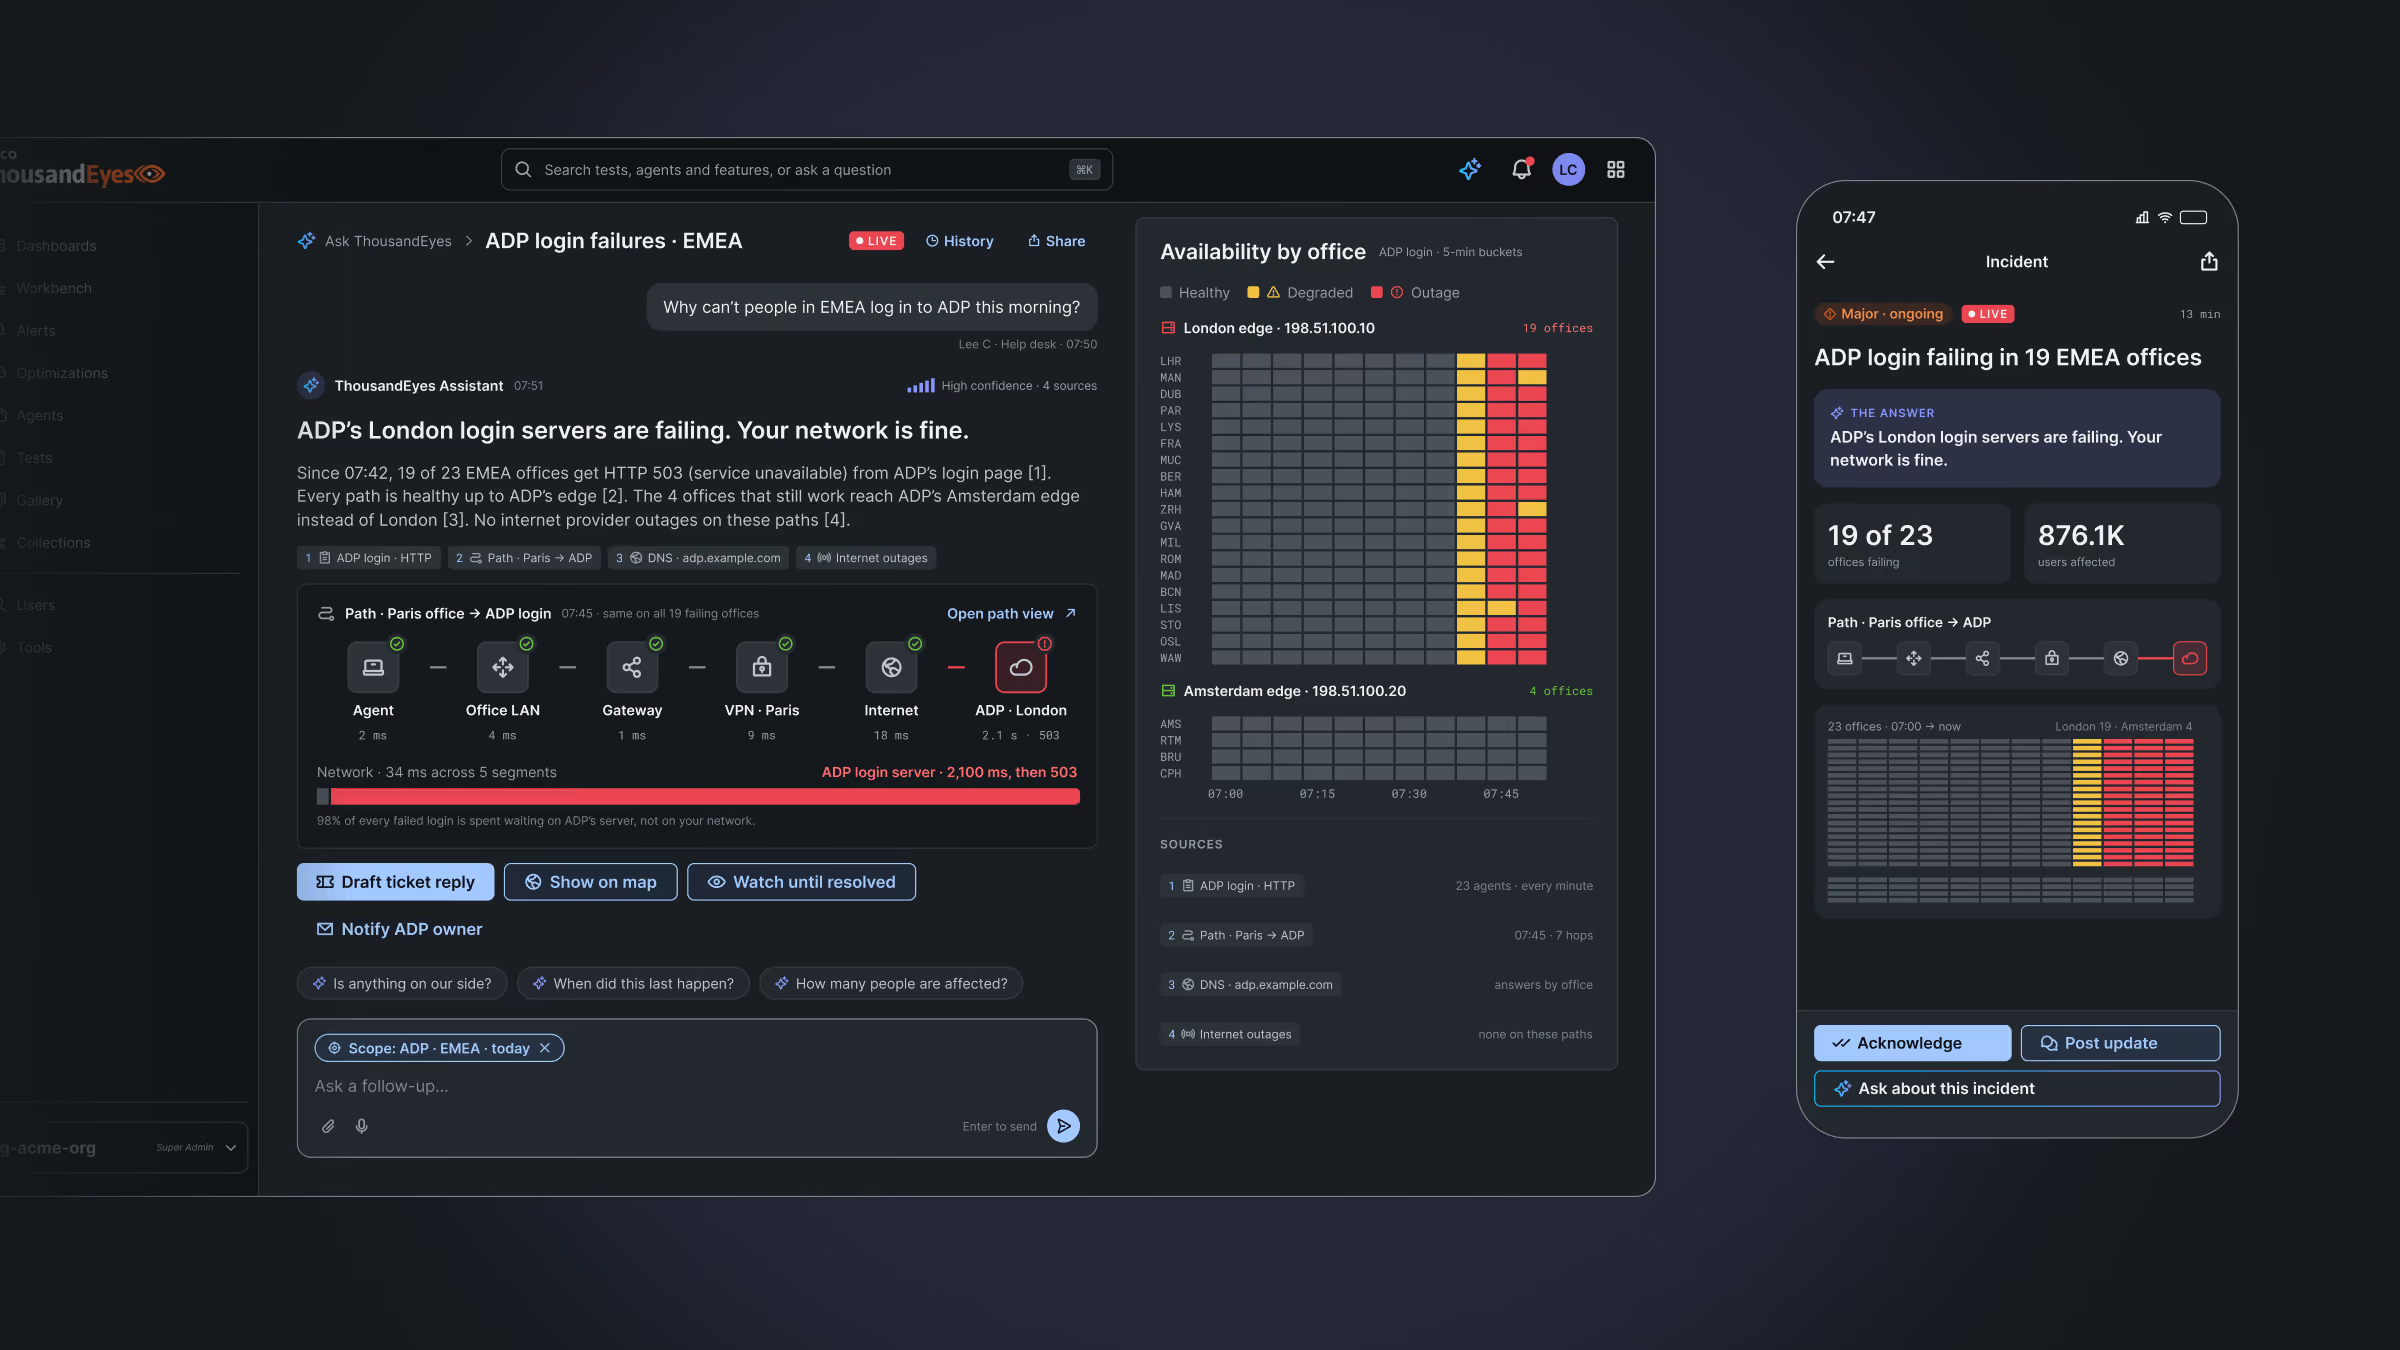
Dashboard and mobile view showing ADP login failures in EMEA with a message that ADP's London login servers are failing though the network is fine; 19 of 23 offices are experiencing HTTP 503 errors, with detailed path metrics, office availability status indicating most London offices are down while Amsterdam offices are functioning, and options to draft ticket replies, view maps, and watch issue resolution.
By the numbers

Interesting stats

The concept reads one dataset many ways, with rules drawn from what already worked.

Values in one dataset

1,824

Every view in the concept reads the same latency data, from a heatmap to a ranked worst moment.

Contrast, white on orange

3.2:1

It falls below WCAG 2.1 AA for body text, so we kept Cisco orange to accents.

Platforms

3

Each one would lead with a plain verdict, on the desk, the phone and the wrist.
Web, phone and watch.

Altitudes

3

Our infographics for Cisco ThousandEyes show one request in milliseconds, one day in hours and one route change from orbit.

Rules for dense data

6

They came from an audit of what already worked in ThousandEyes.

From the audit.

Components

48

A micro design system carries color, type and space as variables, in dark and light.

Next case

U.S. Navy

A campus sample of how Navy stations could look more inviting.

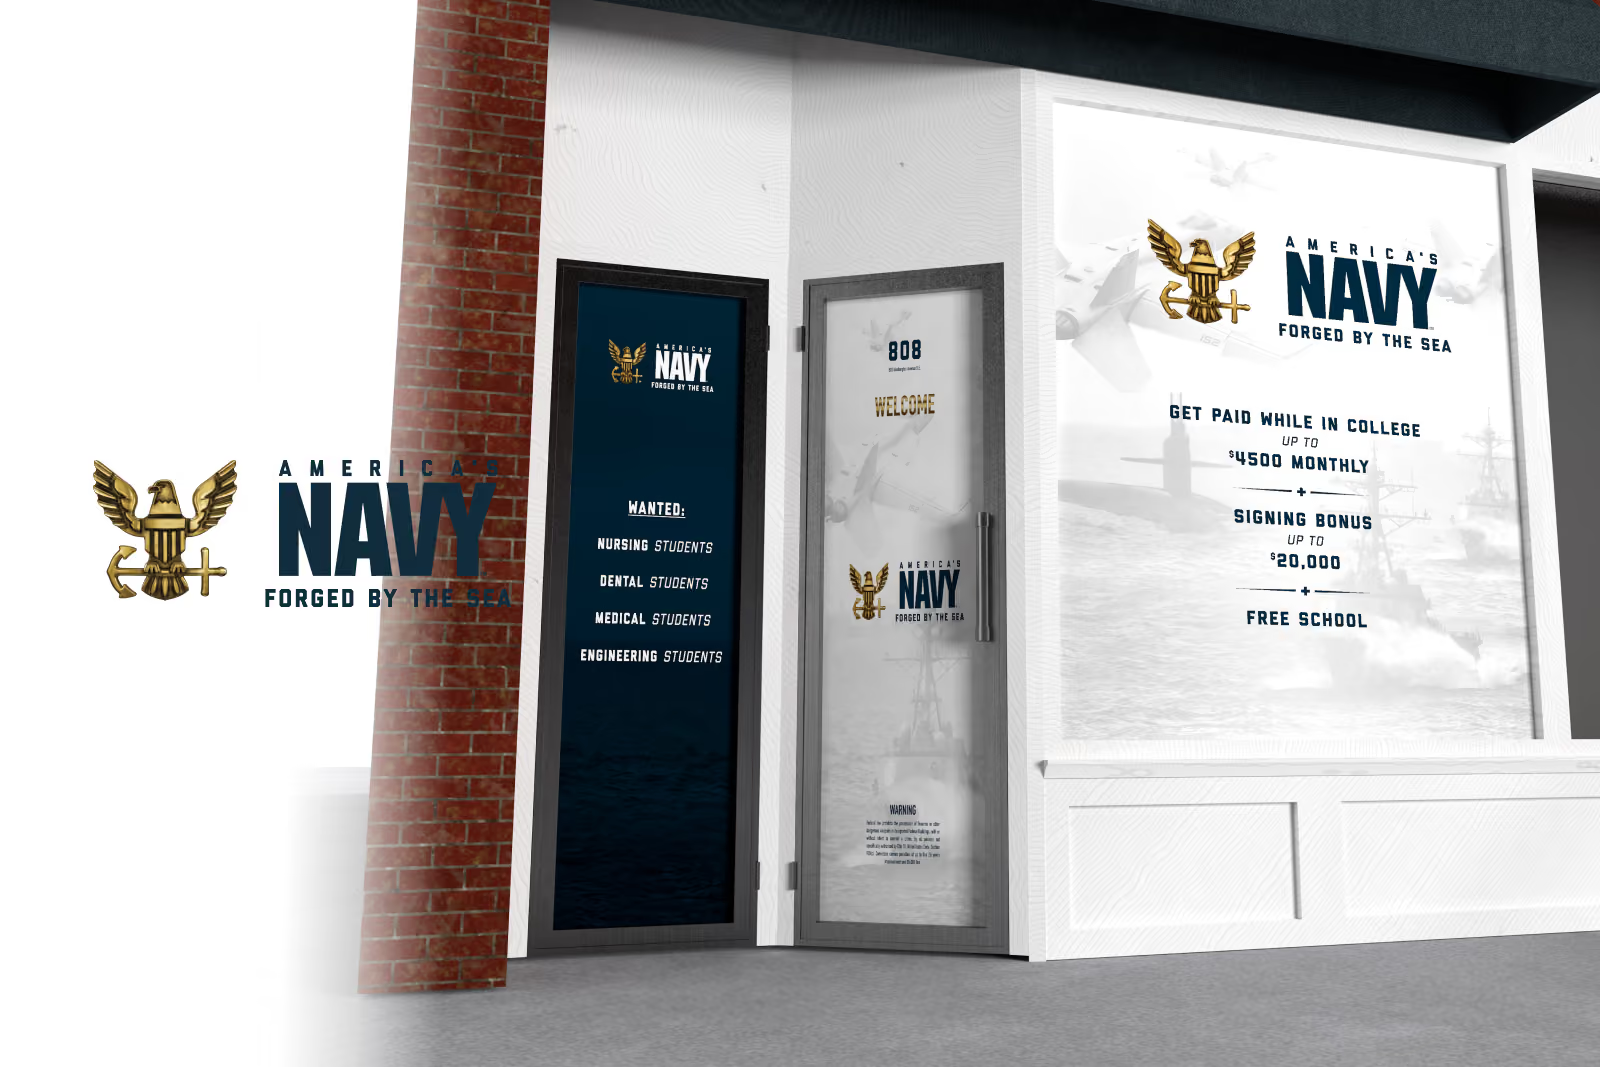
Rendering of the pilot Navy recruiting station storefront, its window graphics beside the America's Navy, Forged by the Sea mark